- Table View
- List View
Think Complexity: Complexity Science and Computational Modeling (Oreilly And Associate Ser.)
by Allen DowneyComplexity science uses computation to explore the physical and social sciences. In Think Complexity, you’ll use graphs, cellular automata, and agent-based models to study topics in physics, biology, and economics.Whether you’re an intermediate-level Python programmer or a student of computational modeling, you’ll delve into examples of complex systems through a series of worked examples, exercises, case studies, and easy-to-understand explanations.In this updated second edition, you will:Work with NumPy arrays and SciPy methods, including basic signal processing and Fast Fourier TransformStudy abstract models of complex physical systems, including power laws, fractals and pink noise, and Turing machinesGet Jupyter notebooks filled with starter code and solutions to help you re-implement and extend original experiments in complexity; and models of computation like Turmites, Turing machines, and cellular automataExplore the philosophy of science, including the nature of scientific laws, theory choice, and realism and instrumentalismIdeal as a text for a course on computational modeling in Python, Think Complexity also helps self-learners gain valuable experience with topics and ideas they might not encounter otherwise.
R Cookbook: Proven Recipes for Data Analysis, Statistics, and Graphics (Cookbook Ser.)
by Paul Teetor Jd LongPerform data analysis with R quickly and efficiently with more than 275 practical recipes in this expanded second edition. The R language provides everything you need to do statistical work, but its structure can be difficult to master. These task-oriented recipes make you productive with R immediately. Solutions range from basic tasks to input and output, general statistics, graphics, and linear regression.Each recipe addresses a specific problem and includes a discussion that explains the solution and provides insight into how it works. If you’re a beginner, R Cookbook will help get you started. If you’re an intermediate user, this book will jog your memory and expand your horizons. You’ll get the job done faster and learn more about R in the process.Create vectors, handle variables, and perform basic functionsSimplify data input and outputTackle data structures such as matrices, lists, factors, and data framesWork with probability, probability distributions, and random variablesCalculate statistics and confidence intervals and perform statistical testsCreate a variety of graphic displaysBuild statistical models with linear regressions and analysis of variance (ANOVA)Explore advanced statistical techniques, such as finding clusters in your data
Data Science from Scratch: First Principles with Python
by Joel GrusData science libraries, frameworks, modules, and toolkits are great for doing data science, but they’re also a good way to dive into the discipline without actually understanding data science. With this updated second edition, you’ll learn how many of the most fundamental data science tools and algorithms work by implementing them from scratch.If you have an aptitude for mathematics and some programming skills, author Joel Grus will help you get comfortable with the math and statistics at the core of data science, and with hacking skills you need to get started as a data scientist. Today’s messy glut of data holds answers to questions no one’s even thought to ask. This book provides you with the know-how to dig those answers out.
Practical Time Series Analysis: Prediction with Statistics and Machine Learning
by Aileen NielsenTime series data analysis is increasingly important due to the massive production of such data through the internet of things, the digitalization of healthcare, and the rise of smart cities. As continuous monitoring and data collection become more common, the need for competent time series analysis with both statistical and machine learning techniques will increase.Covering innovations in time series data analysis and use cases from the real world, this practical guide will help you solve the most common data engineering and analysis challengesin time series, using both traditional statistical and modern machine learning techniques. Author Aileen Nielsen offers an accessible, well-rounded introduction to time series in both R and Python that will have data scientists, software engineers, and researchers up and running quickly.You’ll get the guidance you need to confidently:Find and wrangle time series dataUndertake exploratory time series data analysisStore temporal dataSimulate time series dataGenerate and select features for a time seriesMeasure errorForecast and classify time series with machine or deep learningEvaluate accuracy and performance
Mastering Spark with R: The Complete Guide to Large-Scale Analysis and Modeling
by Javier Luraschi Kevin Kuo Edgar RuizIf you’re like most R users, you have deep knowledge and love for statistics. But as your organization continues to collect huge amounts of data, adding tools such as Apache Spark makes a lot of sense. With this practical book, data scientists and professionals working with large-scale data applications will learn how to use Spark from R to tackle big data and big compute problems.Authors Javier Luraschi, Kevin Kuo, and Edgar Ruiz show you how to use R with Spark to solve different data analysis problems. This book covers relevant data science topics, cluster computing, and issues that should interest even the most advanced users.Analyze, explore, transform, and visualize data in Apache Spark with RCreate statistical models to extract information and predict outcomes; automate the process in production-ready workflowsPerform analysis and modeling across many machines using distributed computing techniquesUse large-scale data from multiple sources and different formats with ease from within SparkLearn about alternative modeling frameworks for graph processing, geospatial analysis, and genomics at scaleDive into advanced topics including custom transformations, real-time data processing, and creating custom Spark extensions
Practical Data Science with SAP: Machine Learning Techniques for Enterprise Data
by Greg Foss Paul ModdermanLearn how to fuse today's data science tools and techniques with your SAP enterprise resource planning (ERP) system. With this practical guide, SAP veterans Greg Foss and Paul Modderman demonstrate how to use several data analysis tools to solve interesting problems with your SAP data.Data engineers and scientists will explore ways to add SAP data to their analysis processes, while SAP business analysts will learn practical methods for answering questions about the business. By focusing on grounded explanations of both SAP processes and data science tools, this book gives data scientists and business analysts powerful methods for discovering deep data truths.You'll explore:Examples of how data analysis can help you solve several SAP challengesNatural language processing for unlocking the secrets in textData science techniques for data clustering and segmentationMethods for detecting anomalies in your SAP dataData visualization techniques for making your data come to life
Mastering Shiny
by Hadley WickhamMaster the Shiny web framework—and take your R skills to a whole new level. By letting you move beyond static reports, Shiny helps you create fully interactive web apps for data analyses. Users will be able to jump between datasets, explore different subsets or facets of the data, run models with parameter values of their choosing, customize visualizations, and much more.Hadley Wickham from RStudio shows data scientists, data analysts, statisticians, and scientific researchers with no knowledge of HTML, CSS, or JavaScript how to create rich web apps from R. This in-depth guide provides a learning path that you can follow with confidence, as you go from a Shiny beginner to an expert developer who can write large, complex apps that are maintainable and performant.Get started: Discover how the major pieces of a Shiny app fit togetherPut Shiny in action: Explore Shiny functionality with a focus on code samples, example apps, and useful techniquesMaster reactivity: Go deep into the theory and practice of reactive programming and examine reactive graph componentsApply best practices: Examine useful techniques for making your Shiny apps work well in production
Graph Algorithms: Practical Examples in Apache Spark and Neo4j
by Mark Needham Amy E. HodlerDiscover how graph algorithms can help you leverage the relationships within your data to develop more intelligent solutions and enhance your machine learning models. You’ll learn how graph analytics are uniquely suited to unfold complex structures and reveal difficult-to-find patterns lurking in your data. Whether you are trying to build dynamic network models or forecast real-world behavior, this book illustrates how graph algorithms deliver value—from finding vulnerabilities and bottlenecks to detecting communities and improving machine learning predictions.This practical book walks you through hands-on examples of how to use graph algorithms in Apache Spark and Neo4j—two of the most common choices for graph analytics. Also included: sample code and tips for over 20 practical graph algorithms that cover optimal pathfinding, importance through centrality, and community detection.Learn how graph analytics vary from conventional statistical analysisUnderstand how classic graph algorithms work, and how they are appliedGet guidance on which algorithms to use for different types of questionsExplore algorithm examples with working code and sample datasets from Spark and Neo4jSee how connected feature extraction can increase machine learning accuracy and precisionWalk through creating an ML workflow for link prediction combining Neo4j and Spark
Learning Spark: Lightning-Fast Data Analytics
by Denny Lee Jules S. Damji Brooke Wenig Tathagata DasData is bigger, arrives faster, and comes in a variety of formatsâ??and it all needs to be processed at scale for analytics or machine learning. But how can you process such varied workloads efficiently? Enter Apache Spark.Updated to include Spark 3.0, this second edition shows data engineers and data scientists why structure and unification in Spark matters. Specifically, this book explains how to perform simple and complex data analytics and employ machine learning algorithms. Through step-by-step walk-throughs, code snippets, and notebooks, youâ??ll be able to:Learn Python, SQL, Scala, or Java high-level Structured APIsUnderstand Spark operations and SQL EngineInspect, tune, and debug Spark operations with Spark configurations and Spark UIConnect to data sources: JSON, Parquet, CSV, Avro, ORC, Hive, S3, or KafkaPerform analytics on batch and streaming data using Structured StreamingBuild reliable data pipelines with open source Delta Lake and SparkDevelop machine learning pipelines with MLlib and productionize models using MLflow
Behavioral Data Analysis with R and Python: Customer-driven Data For Real Business Results
by Florent BuissonHarness the full power of the behavioral data in your company by learning tools specifically designed for behavioral data analysis. Common data science algorithms and predictive analytics tools treat customer behavioral data, such as clicks on a website or purchases in a supermarket, the same as any other data. Instead, this practical guide introduces powerful methods specifically tailored for behavioral data analysis.Advanced experimental design helps you get the most out of your A/B tests, while causal diagrams allow you to tease out the causes of behaviors even when you can't run experiments. Written in an accessible style for data scientists, business analysts, and behavioral scientists, thispractical book provides complete examples and exercises in R and Python to help you gain more insight from your data--immediately.Understand the specifics of behavioral dataExplore the differences between measurement and predictionLearn how to clean and prepare behavioral dataDesign and analyze experiments to drive optimal business decisionsUse behavioral data to understand and measure cause and effectSegment customers in a transparent and insightful way
Practical Statistics for Data Scientists: 50+ Essential Concepts Using R and Python
by Peter Bruce Andrew Bruce Peter GedeckStatistical methods are a key part of data science, yet few data scientists have formal statistical training. Courses and books on basic statistics rarely cover the topic from a data science perspective. The second edition of this popular guide adds comprehensive examples in Python, provides practical guidance on applying statistical methods to data science, tells you how to avoid their misuse, and gives you advice on what’s important and what’s not.Many data science resources incorporate statistical methods but lack a deeper statistical perspective. If you’re familiar with the R or Python programming languages and have some exposure to statistics, this quick reference bridges the gap in an accessible, readable format.With this book, you’ll learn:Why exploratory data analysis is a key preliminary step in data scienceHow random sampling can reduce bias and yield a higher-quality dataset, even with big dataHow the principles of experimental design yield definitive answers to questionsHow to use regression to estimate outcomes and detect anomaliesKey classification techniques for predicting which categories a record belongs toStatistical machine learning methods that "learn" from dataUnsupervised learning methods for extracting meaning from unlabeled data
The AI Ladder: Accelerate Your Journey to AI
by Rob Thomas Paul ZikopoulosAI may be the greatest opportunity of our time, with the potential to add nearly $16 trillion to the global economy over the next decade. But so far, adoption has been much slower than anticipated, or so headlines may lead you to believe. With this practical guide, business leaders will discover where they are in their AI journey and learn the steps necessary to successfully scale AI throughout their organization.Authors Rob Thomas and Paul Zikopoulos from IBM introduce C-suite executives and business professionals to the AI Ladder—a unified, prescriptive approach to help them understand and accelerate the AI journey. Complete with real-world examples and real-life experiences, this book explores AI drivers, value, and opportunity, as well as the adoption challenges organizations face. Understand why you can’t have AI without an information architecture (IA)Appreciate how AI is as much a cultural change as it is a technological oneCollect data and make it simple and accessible, regardless of where it livesOrganize data to create a business-ready analytics foundationAnalyze data, and build and scale AI with trust and transparencyInfuse AI throughout your entire business and create intelligent workflows
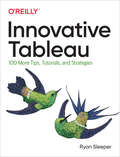
Innovative Tableau: 100 More Tips, Tutorials, and Strategies
by Ryan SleeperLevel up with Tableau to build eye-catching, easy-to-interpret data visualizations. In this follow-up guide to Practical Tableau, author Ryan Sleeper takes you through a collection of unique tips and tutorials for using this popular software. Beginning to advanced Tableau users will learn how to go beyond Show Me to make better charts and learn dozens of tricks to improve both the author and user experience.Featuring many approaches he developed himself, Ryan shows you how to create charts that empower Tableau users to explore, understand, and derive value from their data. He also shares many of his favorite tricks that enabled him to become a Tableau Zen Master, Tableau Public Visualization of the Year author, and Tableau Global Iron Viz Champion.Learn what’s new in Tableau since Practical Tableau was releasedExamine unique new charts—timelines, custom gauges, and leapfrog charts—plus innovations to traditional charts such as highlight tables, scatter plots, and mapsGet tips that can help make a Tableau developer’s life easierUnderstand what developers can do to make users’ lives easier
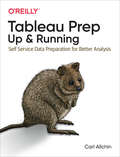
Tableau Prep: Self-service Data Preparation For Better Analysis
by Carl AllchinFor self-service data preparation, Tableau Prep is relatively easy to use—as long as you know how to clean and organize your datasets. Carl Allchin, from The Information Lab in London, gets you up to speed on Tableau Prep through a series of practical lessons that include methods for preparing, cleaning, automating, organizing, and outputting your datasets.Based on Allchin’s popular blog, Preppin’ Data, this practical guide takes you step-by-step through Tableau Prep’s fundamentals. Self-service data preparation reduces the time it takes to complete data projects and improves the quality of your analyses. Discover how Tableau Prep helps you access your data and turn it into valuable information.Know what to look for when you prepare dataLearn which Tableau Prep functions to use when working with data fieldsAnalyze the shape and profile of your datasetOutput data for analysis and learn how Tableau Prep automates your workflowLearn how to clean your dataset using Tableau Prep functionsExplore ways to use Tableau Prep techniques in real-world scenariosMake your data available to others by managing and documenting the output
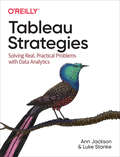
Tableau Strategies: Solving Real, Practical Problems with Data Analytics
by Ann Jackson Luke StankeIf you want to increase Tableau's value to your organization, this practical book has your back. Authors Ann Jackson and Luke Stanke guide data analysts through strategies for solving real-world analytics problems using Tableau. Starting with the basics and building toward advanced topics such as multidimensional analysis and user experience, you'll explore pragmatic and creative examples that you can apply to your own data.Staying competitive today requires the ability to quickly analyze and visualize data and make data-driven decisions. With this guide, data practitioners and leaders alike will learn strategies for building compelling and purposeful visualizations, dashboards, and data products. Every chapter contains the why behind the solution and the technical knowledge you need to make it work.Use this book as a high-value on-the-job reference guide to TableauVisualize different data types and tackle specific data challengesCreate compelling data visualizations, dashboards, and data productsLearn how to generate industry-specific analyticsExplore categorical and quantitative analysis and comparisonsUnderstand geospatial, dynamic, statistical, and multivariate analysisCommunicate the value of the Tableau platform to your team and to stakeholders
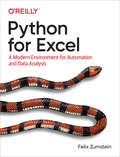
Python for Excel: A Modern Environment For Automation And Data Analysis
by Felix ZumsteinWhile Excel remains ubiquitous in the business world, recent Microsoft feedback forums are full of requests to include Python as an Excel scripting language. In fact, it's the top feature requested. What makes this combination so compelling? In this hands-on guide, Felix Zumstein--creator of xlwings, a popular open source package for automating Excel with Python--shows experienced Excel users how to integrate these two worlds efficiently.Excel has added quite a few new capabilities over the past couple of years, but its automation language, VBA, stopped evolving a long time ago. Many Excel power users have already adopted Python for daily automation tasks. This guide gets you started.Use Python without extensive programming knowledgeGet started with modern tools, including Jupyter notebooks and Visual Studio codeUse pandas to acquire, clean, and analyze data and replace typical Excel calculationsAutomate tedious tasks like consolidation of Excel workbooks and production of Excel reportsUse xlwings to build interactive Excel tools that use Python as a calculation engineConnect Excel to databases and CSV files and fetch data from the internet using Python codeUse Python as a single tool to replace VBA, Power Query, and Power Pivot
Hands-On Data Visualization: Interactive Storytelling From Spreadsheets To Code
by Jack Dougherty Ilya IlyankouTell your story and show it with data, using free and easy-to-learn tools on the web. This introductory book teaches you how to design interactive charts and customized maps for your website, beginning with simple drag-and-drop tools such as Google Sheets, Datawrapper, and Tableau Public. You'll also gradually learn how to edit open source code templates like Chart.js, Highcharts, and Leaflet on GitHub.Hands-On Data Visualization takes you step-by-step through tutorials, real-world examples, and online resources. This practical guide is ideal for students, nonprofit organizations, small business owners, local governments, journalists, academics, and anyone who wants to take data out of spreadsheets and turn it into lively interactive stories. No coding experience is required.Build interactive charts and maps and embed them in your websiteUnderstand the principles for designing effective charts and mapsLearn key data visualization concepts to help you choose the right toolsConvert and transform tabular and spatial data to tell your data storyEdit and host Chart.js, Highcharts, and Leaflet map code templates on GitHubLearn how to detect bias in charts and maps produced by others
Data Science at the Command Line: Obtain, Scrub, Explore, and Model Data with Unix Power Tools
by Jeroen JanssensThis thoroughly revised guide demonstrates how the flexibility of the command line can help you become a more efficient and productive data scientist. You'll learn how to combine small yet powerful command-line tools to quickly obtain, scrub, explore, and model your data. To get you started, author Jeroen Janssens provides a Docker image packed with over 100 Unix power tools--useful whether you work with Windows, macOS, or Linux.You'll quickly discover why the command line is an agile, scalable, and extensible technology. Even if you're comfortable processing data with Python or R, you'll learn how to greatly improve your data science workflow by leveraging the command line's power. This book is ideal for data scientists, analysts, engineers, system administrators, and researchers.Obtain data from websites, APIs, databases, and spreadsheetsPerform scrub operations on text, CSV, HTML, XML, and JSON filesExplore data, compute descriptive statistics, and create visualizationsManage your data science workflowCreate your own tools from one-liners and existing Python or R codeParallelize and distribute data-intensive pipelinesModel data with dimensionality reduction, regression, and classification algorithmsLeverage the command line from Python, Jupyter, R, RStudio, and Apache Spark
SQL for Data Analysis: Advanced Techniques for Transforming Data into Insights
by Cathy TanimuraWith the explosion of data, computing power, and cloud data warehouses, SQL has become an even more indispensable tool for the savvy analyst or data scientist. This practical book reveals new and hidden ways to improve your SQL skills, solve problems, and make the most of SQL as part of your workflow.You'll learn how to use both common and exotic SQL functions such as joins, window functions, subqueries, and regular expressions in new, innovative ways--as well as how to combine SQL techniques to accomplish your goals faster, with understandable code. If you work with SQL databases, this is a must-have reference.Learn the key steps for preparing your data for analysisPerform time series analysis using SQL's date and time manipulationsUse cohort analysis to investigate how groups change over timeUse SQL's powerful functions and operators for text analysisDetect outliers in your data and replace them with alternate valuesEstablish causality using experiment analysis, also known as A/B testing
TensorFlow 2 Pocket Reference: Building and Deploying Machine Learning Models
by Kc TungThis easy-to-use reference for TensorFlow 2 design patterns in Python will help you make informed decisions for various use cases. Author KC Tung addresses common topics and tasks in enterprise data science and machine learning practices rather than focusing on TensorFlow itself.When and why would you feed training data as using NumPy or a streaming dataset? How would you set up cross-validations in the training process? How do you leverage a pretrained model using transfer learning? How do you perform hyperparameter tuning? Pick up this pocket reference and reduce the time you spend searching through options for your TensorFlow use cases.Understand best practices in TensorFlow model patterns and ML workflowsUse code snippets as templates in building TensorFlow models and workflowsSave development time by integrating prebuilt models in TensorFlow HubMake informed design choices about data ingestion, training paradigms, model saving, and inferencingAddress common scenarios such as model design style, data ingestion workflow, model training, and tuning
Think Bayes: Bayesian Statistics In Python
by Allen B. DowneyIf you know how to program, you're ready to tackle Bayesian statistics. With this book, you'll learn how to solve statistical problems with Python code instead of mathematical formulas, using discrete probability distributions rather than continuous mathematics. Once you get the math out of the way, the Bayesian fundamentals will become clearer and you'll begin to apply these techniques to real-world problems.Bayesian statistical methods are becoming more common and more important, but there aren't many resources available to help beginners. Based on undergraduate classes taught by author Allen B. Downey, this book's computational approach helps you get a solid start.Use your programming skills to learn and understand Bayesian statisticsWork with problems involving estimation, prediction, decision analysis, evidence, and Bayesian hypothesis testingGet started with simple examples, using coins, dice, and a bowl of cookiesLearn computational methods for solving real-world problems
Tableau Desktop Cookbook: Quick & Simple Recipes to Help You Navigate Tableau Desktop
by Lorna BrownWhether you're a beginner just learning how to create data visualizations or a Jedi who's already used Tableau for years, this cookbook has a recipe for everyone. Author Lorna Brown provides more than 100 practical recipes to enhance the way you build Tableau dashboards--and helps you understand your data through the power of Tableau Desktop's interactive datavisualizations.With this cookbook, Tableau beginners will learn hands-on how this unique self-serve tool works, while experienced users will find this book to be an ideal reference guide on how to employ specific techniques. It also links you to online resources and community features, such as Tableau Tip Tuesday and Workout Wednesday. By the time you reach the end, you'll be a competent user of Tableau Desktop.You'll learn how to:Build both basic and complex data visualizations with Tableau DesktopGain hands-on experience with Tableau's latest features, including set and parameter actionsCreate interactive dashboards to support business questionsImprove your analytical skills to enhance the visualizations you've already createdLearn data visualization skills and best practices to help you and your organization
Learning Algorithms: A Programmer's Guide to Writing Better Code
by George HeinemanWhen it comes to writing efficient code, every software professional needs to have an effective working knowledge of algorithms. In this practical book, author George Heineman (Algorithms in a Nutshell) provides concise and informative descriptions of key algorithms that improve coding. Software developers, testers, and maintainers will discover how algorithms solve computational problems creatively.Each chapter builds on earlier chapters through eye-catching visuals and a steady rollout of essential concepts, including an algorithm analysis to classify the performance of every algorithm presented in the book. At the end of each chapter, you'll get to apply what you've learned to a novel challenge problem -- simulating the experience you might find in a technical code interview.With this book, you will:Examine fundamental algorithms central to computer science and software engineeringLearn common strategies for efficient problem solving -- such as divide and conquer, dynamic programming, and greedy approachesAnalyze code to evaluate time complexity using big O notationUse existing Python libraries and data structures to solve problems using algorithmsUnderstand the main steps of important algorithms
Python and R for the Modern Data Scientist
by Rick J. Scavetta Boyan AngelovSuccess in data science depends on the flexible and appropriate use of tools. That includes Python and R, two of the foundational programming languages in the field. This book guides data scientists from the Python and R communities along the path to becoming bilingual. By recognizing the strengths of both languages, you'll discover new ways to accomplish data science tasks and expand your skill set.Authors Rick Scavetta and Boyan Angelov explain the parallel structures of these languages and highlight where each one excels, whether it's their linguistic features or the powers of their open source ecosystems. You'll learn how to use Python and R together in real-world settings and broaden your job opportunities as a bilingual data scientist.Learn Python and R from the perspective of your current languageUnderstand the strengths and weaknesses of each languageIdentify use cases where one language is better suited than the otherUnderstand the modern open source ecosystem available for both, including packages, frameworks, and workflowsLearn how to integrate R and Python in a single workflowFollow a case study that demonstrates ways to use these languages together
Tableau Desktop Pocket Reference: Essential Features, Syntax, and Data Visualizations
by Ryan SleeperIn a crowded field of data visualization and analytics tools, Tableau Desktop has emerged as the clear leader. This is partly due to its ease of use, but once you dive into Tableau's extensive feature set, you'll understand just how powerful and flexible this software can be for your business or organization.With this handy pocket reference, author Ryan Sleeper (Innovative Tableau) shows you how to translate the vast amounts of data into useful information. Tableau has done an amazing job of making valuable insights accessible to analysts and executives who would otherwise need to rely on IT. This book quickly guides you through Tableau Desktop's learning curve.You'll learn:How to shape data for use with Tableau DesktopHow to create the most effective chart typesCore concepts including discrete versus continuousMust-know technical features including filters, parameters, and setsKey syntax for creating the most useful analysesHow to bring it all together with dashboardsAnd more!
