- Table View
- List View
Visualizing Health and Healthcare Data: Creating Clear and Compelling Visualizations to "See How You're Doing"
by Katherine Rowell Lindsay Betzendahl Cambria BrownThe only data visualization book written by and for health and healthcare professionals. In health and healthcare, data and information are coming at organizations faster than they can consume and interpret it. Health providers, payers, public health departments, researchers, and health information technology groups know the ability to analyze and communicate this vast array of data in a clear and compelling manner is paramount to success. However, they simply cannot find experienced people with the necessary qualifications. The quickest (and often the only) route to meeting this challenge is to hire smart people and train them. Visualizing Health and Healthcare Data: Creating Clear and Compelling Visualizations to "See how You're Doing" is a one-of-a-kind book for health and healthcare professionals to learn the best practices of data visualization specific to their field. It provides a high-level summary of health and healthcare data, an overview of relevant visual intelligence research, strategies and techniques to gather requirements, and how to build strong teams with the expertise required to create dashboards and reports that people love to use. Clear and detailed explanations of data visualization best practices will help you understand the how and the why. Learn how to build beautiful and useful data products that deliver powerful insights for the end user Follow along with examples of data visualization best practices, including table and graph design for health and healthcare data Learn the difference between dashboards, reports, multidimensional exploratory displays and infographics (and why it matters) Avoid common mistakes in data visualization by learning why they do not work and better ways to display the data Written by a top leader in the field of health and healthcare data visualization, this book is an excellent resource for top management in healthcare, as well as entry-level to experienced data analysts in any health-related organization.
Visualizing Graph Data
by Corey LanumSummaryVisualizing Graph Data teaches you not only how to build graph data structures, but also how to create your own dynamic and interactive visualizations using a variety of tools. This book is loaded with fascinating examples and case studies to show you the real-world value of graph visualizations. Purchase of the print book includes a free eBook in PDF, Kindle, and ePub formats from Manning Publications.About the TechnologyAssume you are doing a great job collecting data about your customers and products. Are you able to turn your rich data into important insight? Complex relationships in large data sets can be difficult to recognize. Visualizing these connections as graphs makes it possible to see the patterns, so you can find meaning in an otherwise over-whelming sea of facts.About the BookVisualizing Graph Data teaches you how to understand graph data, build graph data structures, and create meaningful visualizations. This engaging book gently introduces graph data visualization through fascinating examples and compelling case studies. You'll discover simple, but effective, techniques to model your data, handle big data, and depict temporal and spatial data. By the end, you'll have a conceptual foundation as well as the practical skills to explore your own data with confidence.What's InsideTechniques for creating effective visualizationsExamples using the Gephi and KeyLines visualization packagesReal-world case studiesAbout the ReaderNo prior experience with graph data is required.About the AuthorCorey Lanum has decades of experience building visualization and analysis applications for companies and government agencies around the globe.Table of ContentsPART 1 - GRAPH VISUALIZATION BASICSGetting to know graph visualizationCase studiesAn introduction to Gephi and KeyLinesPART 2 VISUALIZE YOUR OWN DATAData modelingHow to build graph visualizationsCreating interactive visualizationsHow to organize a chartBig data: using graphs when there's too much dataDynamic graphs: how to show data over timeGraphs on maps: the where of graph visualization
Visualizing Google Cloud: 101 Illustrated References for Cloud Engineers and Architects
by Priyanka VergadiaEasy-to-follow visual walkthrough of every important part of the Google Cloud Platform The Google Cloud Platform incorporates dozens of specialized services that enable organizations to offload technological needs onto the cloud. From routine IT operations like storage to sophisticated new capabilities including artificial intelligence and machine learning, the Google Cloud Platform offers enterprises the opportunity to scale and grow efficiently. In Visualizing Google Cloud: Illustrated References for Cloud Engineers & Architects, Google Cloud expert Priyanka Vergadia delivers a fully illustrated, visual guide to matching the best Google Cloud Platform services to your own unique use cases. After a brief introduction to the major categories of cloud services offered by Google, the author offers approximately 100 solutions divided into eight categories of services included in Google Cloud Platform: Compute Storage Databases Data Analytics Data Science, Machine Learning and Artificial Intelligence Application Development and Modernization with Containers Networking Security You’ll find richly illustrated flowcharts and decision diagrams with straightforward explanations in each category, making it easy to adopt and adapt Google’s cloud services to your use cases. With coverage of the major categories of cloud models—including infrastructure-, containers-, platforms-, functions-, and serverless—and discussions of storage types, databases and Machine Learning choices, Visualizing Google Cloud: Illustrated References for Cloud Engineers & Architects is perfect for every Google Cloud enthusiast, of course. It is for anyone who is planning a cloud migration or new cloud deployment. It is for anyone preparing for cloud certification, and for anyone looking to make the most of Google Cloud. It is for cloud solutions architects, IT decision-makers, and cloud data and ML engineers. In short, this book is for YOU.
Visualizing Financial Data
by Piotr Kaczmarek Julie RodriguezA fresh take on financial data visualization for greater accuracy and understanding Visualizing Financial Data shows you how to design dynamic, best-of-breed visualizations for better communication of financial data. This book provides a comprehensive set of visualizations tailored to the most common requirements for corporate financial reporting, as well as portfolio, mutual fund, and hedge fund management. This highly visual, full color book showcases a series of cases that push data communication conventions forward, demonstrating and contrasting traditional bar, line, and pie charts against more modern visual methods. The companion website features all of the visualizations discussed, and provides the underlying datasets that you can use to practice on your own or customize the visualizations for your own use. Get a fresh take on visualizations and insight you need to communicate financial data better than ever before. Expand the boundaries of data visualization conventions Optimize data communications, understanding, and disclosure Learn new approaches to traditional charts and visualizations Create exemplary visualizations Visualizing Financial Data shows you newer, better ways of communicating the full meaning of the data, to support efficient, timely, and effective decision-making.
Visualizing Data in R 4: Graphics Using the base, graphics, stats, and ggplot2 Packages
by Margot TollefsonMaster the syntax for working with R’s plotting functions in graphics and stats in this easy reference to formatting plots. The approach in Visualizing Data in R 4 toward the application of formatting in ggplot() will follow the structure of the formatting used by the plotting functions in graphics and stats. This book will take advantage of the new features added to R 4 where appropriate including a refreshed color palette for charts, Cairo graphics with more fonts/symbols, and improved performance from grid graphics including ggplot 2 rendering speed. Visualizing Data in R 4 starts with an introduction and then is split into two parts and six appendices. Part I covers the function plot() and the ancillary functions you can use with plot(). You’ll also see the functions par() and layout(), providing for multiple plots on a page. Part II goes over the basics of using the functions qplot() and ggplot() in the package ggplot2. The default plots generated by the functions qplot() and ggplot() give more sophisticated-looking plots than the default plots done by plot() and are easier to use, but the function plot() is more flexible. Both plot() and ggplot() allow for many layers to a plot. The six appendices will cover plots for contingency tables, plots for continuous variables, plots for data with a limited number of values, functions that generate multiple plots, plots for time series analysis, and some miscellaneous plots. Some of the functions that will be in the appendices include functions that generate histograms, bar charts, pie charts, box plots, and heatmaps. What You Will Learn Use R to create informative graphics Master plot(), qplot(), and ggplot() Discover the canned graphics functions in stats and graphics Format plots generated by plot() and ggplot() Who This Book Is For Those in data science who use R. Some prior experience with R or data science is recommended.
Visualizing Data: Exploring and Explaining Data with the Processing Environment
by Ben FryEnormous quantities of data go unused or underused today, simply because people can't visualize the quantities and relationships in it. Using a downloadable programming environment developed by the author, Visualizing Data demonstrates methods for representing data accurately on the Web and elsewhere, complete with user interaction, animation, and more. How do the 3.1 billion A, C, G and T letters of the human genome compare to those of a chimp or a mouse? What do the paths that millions of visitors take through a web site look like? With Visualizing Data, you learn how to answer complex questions like these with thoroughly interactive displays. We're not talking about cookie-cutter charts and graphs. This book teaches you how to design entire interfaces around large, complex data sets with the help of a powerful new design and prototyping tool called "Processing". Used by many researchers and companies to convey specific data in a clear and understandable manner, the Processing beta is available free. With this tool and Visualizing Data as a guide, you'll learn basic visualization principles, how to choose the right kind of display for your purposes, and how to provide interactive features that will bring users to your site over and over. This book teaches you: The seven stages of visualizing data -- acquire, parse, filter, mine, represent, refine, and interact How all data problems begin with a question and end with a narrative construct that provides a clear answer without extraneous details Several example projects with the code to make them work Positive and negative points of each representation discussed. The focus is on customization so that each one best suits what you want to convey about your data set The book does not provide ready-made "visualizations" that can be plugged into any data set. Instead, with chapters divided by types of data rather than types of display, you'll learn how each visualization conveys the unique properties of the data it represents -- why the data was collected, what's interesting about it, and what stories it can tell. Visualizing Data teaches you how to answer questions, not simply display information.
Visualized Medicine: Emerging Techniques and Developing Frontiers (Advances in Experimental Medicine and Biology #1199)
by Zhe LiuThis book summarizes the recent advancements for visualized medicine in terms of fundamental principles, rapidly emerging techniques and developing frontiers. Especially with the combination of artificial intelligence (AI), medical imaging agents and medical robots, smart medical technologies have been innovated and applied to the clinical uses to serve the fatal human diseases diagnosis, treatment, prognosis and data analysis. This philosophy comprehensively revolutionizes the treatment strategy of human healthcare, and will enable precision medicine and precision surgery further intuitively detectable, smartly analyzable and accurately operational. This book will discuss and conclude: 1) state-of-the-art definition of visualized medicine; 2) advanced techniques and clinical applications of visualized medicine in the past decade; 3) novel frontiers and brand-new technologies, e.g. artificial intelligence (AI), surgical robots, etc. 4) revolutionary impacts on disease diagnosis, treatments and prognosis; 5) future challenges and perspectives.
Visualize This
by Nathan YauPractical data design tips from a data visualization expert of the modern ageData doesn?t decrease; it is ever-increasing and can be overwhelming to organize in a way that makes sense to its intended audience. Wouldn?t it be wonderful if we could actually visualize data in such a way that we could maximize its potential and tell a story in a clear, concise manner? Thanks to the creative genius of Nathan Yau, we can. With this full-color book, data visualization guru and author Nathan Yau uses step-by-step tutorials to show you how to visualize and tell stories with data. He explains how to gather, parse, and format data and then design high quality graphics that help you explore and present patterns, outliers, and relationships.Presents a unique approach to visualizing and telling stories with data, from a data visualization expert and the creator of flowingdata.com, Nathan YauOffers step-by-step tutorials and practical design tips for creating statistical graphics, geographical maps, and information design to find meaning in the numbersDetails tools that can be used to visualize data-native graphics for the Web, such as ActionScript, Flash libraries, PHP, and JavaScript and tools to design graphics for print, such as R and IllustratorContains numerous examples and descriptions of patterns and outliers and explains how to show themVisualize This demonstrates how to explain data visually so that you can present your information in a way that is easy to understand and appealing.
Visualization Psychology
by Danielle Albers Szafir Rita Borgo Min Chen Darren J. Edwards Brian Fisher Lace PadillaThis book designates Visualization Psychology as an interdisciplinary subject. The book contains literature reviews and experimental works that exemplify a range of open questions at this critical intersection. It also includes discourses that envision how the subject may be developed in the coming years and decades. The field of visualization is a rich playground for discovering new knowledge in both visualization and psychology. As visualization techniques augment human cognition, these techniques must be developed and improved by building on theoretical, empirical and methodological knowledge from psychology. At the same time, visualization processes surface numerous phenomena about interactions between the human mind and digital entities, such as data, visual imagery, algorithms, and computer-generated predictions and recommendations. Visualization psychology is a new type of science in the making.
Visualization and Processing of Tensors and Higher Order Descriptors for Multi-Valued Data
by Carl-Fredrik Westin Anna Vilanova Bernhard BurgethArising from the fourth Dagstuhl conference entitled Visualization and Processing of Tensors and Higher Order Descriptors for Multi-Valued Data (2011), this book offers a broad and vivid view of current work in this emerging field. Topics covered range from applications of the analysis of tensor fields to research on their mathematical and analytical properties. Part I, Tensor Data Visualization, surveys techniques for visualization of tensors and tensor fields in engineering, discusses the current state of the art and challenges, and examines tensor invariants and glyph design, including an overview of common glyphs. The second Part, Representation and Processing of Higher-order Descriptors, describes a matrix representation of local phase, outlines mathematical morphological operations techniques, extended for use in vector images, and generalizes erosion to the space of diffusion weighted MRI. Part III, Higher Order Tensors and Riemannian-Finsler Geometry, offers powerful mathematical language to model and analyze large and complex diffusion data such as High Angular Resolution Diffusion Imaging (HARDI) and Diffusion Kurtosis Imaging (DKI). A Part entitled Tensor Signal Processing presents new methods for processing tensor-valued data, including a novel perspective on performing voxel-wise morphometry of diffusion tensor data using kernel-based approach, explores the free-water diffusion model, and reviews proposed approaches for computing fabric tensors, emphasizing trabecular bone research. The last Part, Applications of Tensor Processing, discusses metric and curvature tensors, two of the most studied tensors in geometry processing. Also covered is a technique for diagnostic prediction of first-episode schizophrenia patients based on brain diffusion MRI data. The last chapter presents an interactive system integrating the visual analysis of diffusion MRI tractography with data from electroencephalography.
Visualization and Processing of Higher Order Descriptors for Multi-Valued Data
by Ingrid Hotz Thomas SchultzModern imaging techniques and computational simulations yield complex multi-valued data that require higher-order mathematical descriptors. This book addresses topics of importance when dealing with such data, including frameworks for image processing, visualization and statistical analysis of higher-order descriptors. It also provides examples of the successful use of higher-order descriptors in specific applications and a glimpse of the next generation of diffusion MRI. To do so, it combines contributions on new developments, current challenges in this area and state-of-the-art surveys. Compared to the increasing importance of higher-order descriptors in a range of applications, tools for analysis and processing are still relatively hard to come by. Even though application areas such as medical imaging, fluid dynamics and structural mechanics are very different in nature they face many shared challenges. This book provides an interdisciplinary perspective on this topic with contributions from key researchers in disciplines ranging from visualization and image processing to applications. It is based on the 5th Dagstuhl seminar on Visualization and Processing of Higher Order Descriptors for Multi-Valued Data. This book will appeal to scientists who are working to develop new analysis methods in the areas of image processing and visualization, as well as those who work with applications that generate higher-order data or could benefit from higher-order models and are searching for novel analytical tools.
Visualization and Imputation of Missing Values: With Applications in R (Statistics and Computing)
by Matthias TemplThis book explores visualization and imputation techniques for missing values and presents practical applications using the statistical software R. It explains the concepts of common imputation methods with a focus on visualization, description of data problems and practical solutions using R, including modern methods of robust imputation, imputation based on deep learning and imputation for complex data. By describing the advantages, disadvantages and pitfalls of each method, the book presents a clear picture of which imputation methods are applicable given a specific data set at hand.The material covered includes the pre-analysis of data, visualization of missing values in incomplete data, single and multiple imputation, deductive imputation and outlier replacement, model-based methods including methods based on robust estimates, non-linear methods such as tree-based and deep learning methods, imputation of compositional data, imputation quality evaluation from visual diagnostics to precision measures, coverage rates and prediction performance and a description of different model- and design-based simulation designs for the evaluation. The book also features a topic-focused introduction to R and R code is provided in each chapter to explain the practical application of the described methodology. Addressed to researchers, practitioners and students who work with incomplete data, the book offers an introduction to the subject as well as a discussion of recent developments in the field. It is suitable for beginners to the topic and advanced readers alike.
Visualization Analysis and Design (Ak Peters Visualization Ser.)
by Tamara MunznerLearn How to Design Effective Visualization SystemsVisualization Analysis and Design provides a systematic, comprehensive framework for thinking about visualization in terms of principles and design choices. The book features a unified approach encompassing information visualization techniques for abstract data, scientific visualization techniques
Visualforce Development Cookbook - Second Edition
by Keir BowdenDiscover over 70 real-world examples to overcome the most complex concepts you will face developing with Visualforce About This Book * This book provides an enhanced user experience with dynamically-generated, reactive pages * Access data over additional channels via public web sites and mobile pages * Packed with easy-to-follow recipes, including step-by-step instructions and Apex/Visualforce code downloads this title is the all in one package you need to get more from Visualforce. Who This Book Is For This book will be beneficial to developers who are already well-versed with the basics of Visualforce. An awareness of the standard component library and the purpose of controllers is expected. What You Will Learn * Pass parameters between Visualforce pages * Update attributes in component controllers * Avoid validation errors with action regions * Refresh record details from embedded Visualforce * Create and develop a website template from scratch * Get to know about the Salesforce Lightening Design system and use Visualforce in Salesforce1 * Effectively tackle frequently-faced problems while developing Visualforce pages In Detail Visualforce is a framework that allows developers to build sophisticated, custom user interfaces that can be hosted natively on the Force.com platform. The Visualforce framework includes a tag-based markup language, similar to HTML that is used to write the Visualforce pages and a set of controllers that are used to write business logic to the Visualforce pages. Visualforce Development Cookbook provides solutions to a variety of challenges faced by Salesforce developers and demonstrates how easy it is to build rich, interactive pages using Visualforce. Whether you are looking to make a minor addition to the standard page functionality or override it completely, this book will provide you with the help you require throughout. You will start by learning about the simple utilities and will build up to more advanced techniques for data visualization and to reuse functionality. You will learn how to perform various tasks such as creating multiple records from a single page, visualizing data as charts, using JavaScript to enhance client-side functionality, building a public website, and making data available to a mobile device. With an interesting chapter on tackling common issues faced while developing Visualforce pages, the book provides lots of practical examples to enhance and extend your Salesforce user interface. Style and approach Following a cookbook structure, the book provides recipes on some essential technical scenarios and a few that focus on real-world development problems. This book is packed with illustrations and contains lots of code samples to improve your understanding.
Visualforce Development Cookbook
by Keir BowdenVisualforce Development Cookbook is written in such a way that even complex concepts are explained in an easy-to-understand manner. Following a Cookbook structure, the book covers some essential technical scenarios and includes over 75 recipes focusing on real-world development problems. This book is packed with illustrations and also contains lots of code samples for the better understanding of the reader."Visualforce Development Cookbook" is aimed at developers who have already grasped the basics of Visualforce. Awareness of the standard component library and the purpose of controllers is expected.
Visualforce Developer’s guide
by W.A.Chamil MadusankaThis is a mini tutorial guide that discusses the most important and the most frequently used technical aspects of Visualforce development, thereby making it a perfect companion for Visualforce developers.This book is for Visualforce developers who are looking for a pocket guide that will resolve their most frequently faced issues.
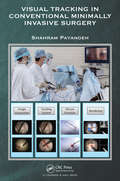
Visual Tracking in Conventional Minimally Invasive Surgery
by Shahram PayandehVisual Tracking in Conventional Minimally Invasive Surgery introduces the various tools and methodologies that can be used to enhance a conventional surgical setup with some degree of automation. The main focus of this book is on methods for tracking surgical tools and how they can be used to assist the surgeon during the surgical operation. Various notions associated with surgeon–computer interfaces and image-guided navigation are explored, with a range of experimental results. The book starts with some basic motivations for minimally invasive surgery and states the various distinctions between robotic and non-robotic (conventional) versions of this procedure. Common components of this type of operation are presented with a review of the literature addressing the automation aspects of such a setup. Examples of tracking results are shown for both motion and gesture recognition of surgical tools, which can be used as part of the surgeon–computer interface. In the case of marker-less tracking, where no special visual markers can be added to the surgical tools, the tracking results are divided into two types of methodology, depending on the nature and the estimate of the visual noise. Details of the tracking methods are presented using standard Kalman filters and particle filters. The last part of the book provides approaches for tracking a region on the surgical scene defined by the surgeon. Examples of how these tracking approaches can be used as part of image-guided navigation are demonstrated. This book is designed for control engineers interested in visual tracking, computer vision researchers and system designers involved with surgical automation, as well as surgeons, biomedical engineers, and robotic researchers.
Visual Texture
by Jiri Filip Michal HaindlThis book surveys the state of the art in multidimensional, physically-correct visual texture modeling. Features: reviews the entire process of texture synthesis, including material appearance representation, measurement, analysis, compression, modeling, editing, visualization, and perceptual evaluation; explains the derivation of the most common representations of visual texture, discussing their properties, advantages, and limitations; describes a range of techniques for the measurement of visual texture, including BRDF, SVBRDF, BTF and BSSRDF; investigates the visualization of textural information, from texture mapping and mip-mapping to illumination- and view-dependent data interpolation; examines techniques for perceptual validation and analysis, covering both standard pixel-wise similarity measures and also methods of visual psychophysics; reviews the applications of visual textures, from visual scene analysis in medical applications, to high-quality visualizations in the automotive industry.
Visual Studio LightSwitch 2012
by Tim LeungLightSwitch 2012 is included as part of the Visual Studio 2012 package. It is a rapid application deployment tool that lets power users and administrators build data-centric business applications for the desktop, cloud, and Web in just a few clicks, with no code required. The basics are very easily understood but more advanced users will hunger for more: how do you design complex layouts? How do you query data using LINQ and other syntax structures? How do you secure your application against malicious use? Visual Studio LightSwitch 2012 answers these questions and more as author Tim Leung--winner of a Microsoft 2011 Community Contributor Award for his LightSwitch expertise--covers this breakthrough product in detail. For serious developers building, enhancing and deploying advanced business applications using LightSwitch makes sense because they can benefit from the elegance, convenience and cost savings afforded by rapid application development before going beyond the "click-and-you''re-done" interface to include the extra value and depth of coding expertise that their clients value. What you''ll learn With Visual Studio LightSwitch 2012, learn how to: Add visibility through with Relationships and Details screens Use customized queries, sorts and filters, and reporting Customize displays via user controls Use multiple line-of-business data sources to aggregate reports Handle events in code and debug applications Master the intricacies of complex user interface design Secure your applications through authentication Write custom . NET code to enhance LightSwitch Deploy maintainable LightSwitch projects Who this book is for Visual Studio LightSwitch 2012 is a book designed for any software developer who wants to take advantage of the rapid application deployment (RAD) experience offered by LightSwitch. It is ideal reading for those wanting to build and design applications correctly from the onset. Developers who have grasped the basics of LightSwitch and are looking to do more will benefit greatly from this book. Anyone struggling to design complex screens and queries in order to meet user requirements will find the answers in this book. Table of Contents Part One - Introducing LightSwitch: Understanding How LightSwitch Works Part One - Introducing LightSwitch: Setting Up Your data Part One - Introducing LightSwitch: Getting Started with Screen Design Part Two - Working With Data: Accessing Data from Code Part Two - Working With Data: Validating Your Data Part Two - Working With Data: Querying Your Data Part Three - Designing User Interfaces: Mastering Screen Design Part Three - Designing User Interfaces: Creating HTML User Interfaces Part Four - Extending the Reach of Your Data: Creating and Using RIA Services Part Four - Extending the Reach of Your Data: Sharing Data with Odata Part Five - Customizing LightSwitch: Creating and Using Silverlight Custom Controls Part Five - Customizing LightSwitch: Creating Custom Control Extensions Part Five - Customizing LightSwitch: Creating Data and Presentation Extensions Part Six - Getting Data Out: Creating and Displaying Reports Part Six - Getting Data Out: Creating and Sending Emails Part Seven - Securing Your Application: Authenticating Your Users Part Seven - Securing Your Application: Authorizing Your Users Part Eight - Going Live with Your Application: Deploying Your Application Appendix A Appendix B Appendix C Appendix D Appendix E
Visual Studio Hacks
by James AveryWith start-up templates for projects ranging from Windows applications to web services, and extensive help and on-line documentation, Visual Studio .NET might be mistaken for a tool for unsophisticated users. It's true that most developers soon discover that the basic operation of Visual Studio is fairly self-explanatory; less obvious are some of the suite's more advanced built-in features. Visual Studio .Net includes a wealth of little-used capabilities, is very customizable, has a complete automation model, and much more. On top of its regular feature set, there are hosts of free add-ins, macros, and power toys that can further enhance the functionality of Visual Studio. This book is all about exploring these things, and in doing so, becoming a better and more efficient developer. Developers will learn how to: Get the most out of projects and solutions, including getting down and dirty with the undocumented format of project and solution files Use these editor features to the fullest, and add additional functionality to the editor through the use of third-party add-ins Learn smarter ways to navigate the application and your own source code Customize shortcut keys, toolbars, menus, the toolbox, and much more Use the debugger successfully not only on your source code, but with T-SQL and scripting languages as well Automatically generate code Learn how the server can be used to interface with databases, services, and performance counters, as well as WMI Use and create Visual Studio add-ins to extend its functionality Offering valuable tips, tools, and tricks, Visual Studio Hacks takes you far beyond the suite's usual capabilities. You can read this book from cover to cover or, because each hack stands its own, you can feel free to browse and jump to the different sections that interest you most. If there's a prerequisite you need to know about, a cross-reference will guide you to the right hack. If you want to experience the full spectrum of Visual Studio's functionality and flexibility, you'll find the perfect guide for exploration in Visual Studio Hacks . Once the final page is turned, you can confidently say that you've been exposed to everything that Visual Studio .NET is capable of doing.
Visual Studio Extensibility Development: Extending Visual Studio IDE for Productivity, Quality, Tooling, and Analysis
by Rishabh VermaLearn the extensibility model of Visual Studio to enhance the Visual Studio integrated development environment (IDE). This book will cover every aspect, starting from developing an extension to publishing it and making it available to the end user. The book begins with an introduction to the basic concepts of Visual Studio including data structures and design patterns and moves forward with the fundamentals of the VS extensibility model. Here you will learn how to work on Roslyn - the .NET compiler platform - and load extensions in VS. Next, you will go through the extensibility model and see how various extensions, such as menus, commands, and tool windows, can be plugged into VS. Moving forward, you’ll cover developing VS extensions and configuring them, along with demonstrations on customizing extension by developing option pages. Further, you will learn to create custom code snippets and use a debugger visualizer. Next, you will go through creation of project and item templates including deployment of VS extensions using continuous integration (CI). Finally, you will learn tips and tricks for Visual Studio and its extensibility and integration with Azure DevOps. After reading Visual Studio Extensibility Development you will be able to develop, deploy, and customize extensions in Visual Studio IDE. What You Will Learn Discover the Visual Studio extensibility and automation model Code Visual Studio extensions from scratchCustomize extensions by developing a tools option page for themCreate project templates, item templates, and code snippets. Work with code generation using T4 templatesCode analysis and refactoring using Roslyn analyzersCreate and deploy a private extension gallery and upload the extensions Upload a VS extension using CIShip your extension to Visual Studio MarketplaceWho This Book Is ForDevelopers in Visual Studio IDE covering C#, Visual Basic (VB), JavaScript, and CSS.
Visual Studio Extensibility Development: Extending Visual Studio IDE for Productivity, Quality, Tooling, Analysis, and Artificial Intelligence
by Rishabh VermaMaster Visual Studio extensibility for an enhanced Visual Studio IDE experience. This book is a comprehensive guide that covers every facet of developing, debugging, and publishing extensions that amplify your productivity, tooling, and analysis within the Visual Studio IDE. This new edition is updated for Visual Studio 2022, which is the latest and greatest version of Visual Studio. Since the last edition, Artificial Intelligence (AI) has taken the world by the storm. This revised edition demonstrates how AI can take your extensions to unparalleled heights using ChatGPT. The book begins with an introduction to the essential concepts of Visual Studio, including data structures and design patterns before diving into the fundamentals of the Visual Studio extensibility model. Here you will learn the anatomy of a VSIX and how extensions are discovered and loaded in Visual Studio. Next, you will explore the extensibility model and see how various extensions, such as menus, commands, and tool windows can be plugged into Visual Studio. Moving forward, you’ll cover developing VS extensions and how they can be made configurable by customizing the UI and options page, and you’ll learn to develop a VS extension that leverages ChatGPT. Next, you will see how to extend the most often used component of Visual Studio, the code editor, before creating your own sample code snippets and templates. This is followed by a demonstration of how to deploy extensions using continuous integration (CI). Finally, you will learn tips and tricks for Visual Studio and its extensibility, along with a few highly valuable extensions. After reading Visual Studio Extensibility Development, you will be able to develop, debug, customize, and deploy extensions in Visual Studio IDE. What You Will Learn Master the art of personalizing extensions through the creation of dedicated tools option pagesExtend commands, editor, and tool window of Visual StudioSeamlessly integrate artificial intelligence in Visual Studio extensionsCreate project templates, item templates, and code snippets to streamline your development processEnhance IntelliSense for your custom project needsPublish your extension in the Visual Studio marketplace Who This Book Is For Developers, Programmers, Engineers, Architects, Instructors, Innovators, Students and Technology enthusiasts leveraging Visual Studio IDE.
Visual Studio Code for Python Programmers
by April SpeightBecome proficient and efficient with Visual Studio Code and learn how to integrate all your external tools! Visual Studio Code for Python Programmers helps Python developers become not just familiar, but productive in Visual Studio Code. To start, you’ll find the steps for installing Visual Studio Code on Windows, Mac and Linux platforms, along with an introduction to the editing features of the workspace. Coverage of more advanced functionality includes managing source code, debugging, unit testing, and Jupyter Notebook support. The book finishes with a walk-through of real-world projects which utilize Visual Studio Code features introduced in the book. For developers, the choice of an editor is a very personal one. You have idiosyncratic needs and wants that are unique to you as a developer. This book will help you learn how to customize Visual Studio Code to meet your needs and Python development workflow. Introduces you to the features of the Visual Studio Code workspace and how those features can be customized Demonstrates how Visual Studio Code allows you to choose your structure according to your needs Covers editing code in Python, including syntax highlighting, code completion, object definition, refactoring, and code navigation Describes Git integration and how to perform common Git functions (commits, checkouts, branches, and merges) from within Visual Studio Code Highlights debugging features for Python developers A final section on Real World Applications will step you through several examples (and features integration with Django, Flask, Jupyter Notebook, Docker, and Azure), so you can hit the ground running with Visual Studio Code.
Visual Studio Code Distilled: Evolved Code Editing for Windows, macOS, and Linux
by Alessandro Del SoleUse Visual Studio Code to write and debug code quickly and efficiently on any platform, for any device, using any programming language, and on the operating system of your choice. Visual Studio Code is an open source and cross-platform development tool that focuses on code editing across a variety of development scenarios, including web, mobile, and cloud development. This second edition of Visual Studio Code Distilled has been updated and expanded with two new chapters on writing apps with Python and building apps for the cloud and deployment to Azure.The book teaches you how to be immediately productive with Visual Studio Code, from the basics to some of the more complex topics. You will learn how to work on individual code files, complete projects, and come away with an understanding of advanced code-editing features that will help you focus on productivity, and source code collaboration with Git.What You Will Learn Get started with practical guidance on Visual Studio Code, including expansive guidance on writing apps with C# and PythonComprehend Visual Studio Code in a way that is not just theory or a list of features, but an approach driven by developer tasks and needsUnderstand integrated support for team collaboration with Git for executing and debugging code, and the many ways you can extend and customize Visual Studio CodeDebug code on multiple platforms through real-world guidance, such as working under corporate networksExpand your coding intelligence from web to mobile to the cloudAcquire valuable tips, tricks, and suggestions from hard-earned, real-world experience to be more productiveWho This Book Is ForAll developers (including JavaScript, Java, NodeJS), not just those with a Microsoft background, who will benefit from learning and using VS code as a cross-platform and cross-language tool
Visual Studio Code Distilled: Evolved Code Editing for Windows, macOS, and Linux
by Alessandro Del SoleUse Visual Studio Code to write and debug code quickly and efficiently on any platform, for any device, using any programming language, and on the operating system of your choice. Visual Studio Code is an open source and cross-platform development tool that focuses on code editing across a variety of development scenarios, including web, mobile, and cloud development. This third edition has been updated to match the latest releases of the environment. Additional updates relate to .NET 7 and explain how to consume AI services from code you write in Visual Studio Code. This new edition is also refreshed with the latest updates, such as enhanced merge editor, creating extensions, support for the Julia language, and much more.The book teaches you how to be immediately productive with Visual Studio Code, from the basics to some of the more complex topics. You will learn how to work on individual code files, complete projects, and come away with an understanding of advanced code-editing features that will help you focus on productivity, and source code collaboration with Git.What You Will Learn Get started with practical guidance on Visual Studio Code, including expansive guidance on writing apps with C# and PythonUnderstand how to edit individual files and how to work with folders by working on the latest workspace trust and multi-root workspacesDebug code on multiple platforms through real-world guidance, such as working under corporate networksPackage code into Docker containers and deploy these to AzureAcquire valuable tips, tricks, and suggestions from hard-earned, real-world experience to be more productiveWho This Book Is ForAll developers (including JavaScript, Java, NodeJS), not just those with a Microsoft background, who will benefit from learning and using VS code as a cross-platform and cross-language tool
