- Table View
- List View
Data Storytelling and Visualization with Tableau: A Hands-on Approach
by Parikshit Narendra Mahalle Prachi Manoj JoshiWith the tremendous growth and availability of the data, this book covers understanding the data, while telling a story with visualization including basic concepts about the data, the relationship and the visualizations. All the technical details that include installation and building the different visualizations are explained in a clear and systematic way. Various aspects pertaining to storytelling and visualization are explained in the book through Tableau. Features Provides a hands-on approach in Tableau in a simplified manner with steps Discusses the broad background of data and its fundamentals, from the Internet of Everything to analytics Emphasizes the use of context in delivering the stories Presents case studies with the building of a dashboard Presents application areas and case studies with identification of the impactful visualization This book will be helpful for professionals, graduate students and senior undergraduate students in Manufacturing Engineering, Civil and Mechanical Engineering, Data Analytics and Data Visualization.
Data Visualization Made Simple: Insights into Becoming Visual
by Kristen SosulskiData Visualization Made Simple is a practical guide to the fundamentals, strategies, and real-world cases for data visualization, an essential skill required in today’s information-rich world. With foundations rooted in statistics, psychology, and computer science, data visualization offers practitioners in almost every field a coherent way to share findings from original research, big data, learning analytics, and more. In nine appealing chapters, the book: examines the role of data graphics in decision-making, sharing information, sparking discussions, and inspiring future research; scrutinizes data graphics, deliberates on the messages they convey, and looks at options for design visualization; and includes cases and interviews to provide a contemporary view of how data graphics are used by professionals across industries Both novices and seasoned designers in education, business, and other areas can use this book’s effective, linear process to develop data visualization literacy and promote exploratory, inquiry-based approaches to visualization problems.
Data Visualization for Design Thinking: Applied Mapping
by Winifred E. NewmanData Visualization for Design Thinking helps you make better maps. Treating maps as applied research, you’ll be able to understand how to map sites, places, ideas, and projects, revealing the complex relationships between what you represent, your thinking, the technology you use, the culture you belong to, and your aesthetic practices. More than 100 examples illustrated with over 200 color images show you how to visualize data through mapping. Includes five in-depth cases studies and numerous examples throughout.
Data Visualization for People of All Ages (ISSN)
by Nancy OrganData visualization is the art and science of making information visible. On paper and in our imaginations, it’s a language of shapes and colors that holds our best ideas and most important questions. As we find ourselves swimming in data of all kinds, visualization can help us to understand, express, and explore the richness of the world around us. No matter your age or background, this book opens the door to new ways of thinking and sharing through the power of data visualization.Data Visualization for People of All Ages is a field guide to visual literacy, born from the author’s personal experience working with world-class scholars, engineers, and scientists. By walking through the different ways of showing data—including color, angle, position, and length—you’ll learn how charts and graphs truly work so that no visualization is ever a mystery or out of reach. It doesn’t stop at what fits on a page, either. You’ll journey into cutting-edge topics like data sonification and data physicalization, using sound and touch to share data across the different senses. Packed with practical examples and exercises to help you connect the dots, this book will teach you how to create and understand data visualizations on your own—all without writing a single line of code or getting tangled up in software.Written with accessibility in mind, this book invites everyone to the table to share the joy of one of today’s most necessary skills. Perfect for home or classroom use, this friendly companion gives people of all ages everything they need to start visualizing with confidence.
Data Visualization in Excel: A Guide for Beginners, Intermediates, and Wonks (AK Peters Visualization Series)
by Jonathan SchwabishThis book closes the gap between what people think Excel can do and what they can achieve in the tool. Over the past few years, recognition of the importance of effectively visualizing data has led to an explosion of data analysis and visualization software tools. But for many people, Microsoft Excel continues to be the workhorse for their data visualization needs, not to mention the only tool that many data workers have access to. Although Excel is not a specialist data visualization platform, it does have strong capabilities. The default chart types do not need to be the limit of the tool’s data visualization capabilities, and users can extend its features by understanding some key elements and strategies. Data Visualization in Excel provides a step-by-step guide to creating more advanced and often more effective data visualizations in Excel and is the perfect guide for anyone who wants to create better, more effective, and more engaging data visualizations.
Data Visualization: Charts, Maps, and Interactive Graphics (ASA-CRC Series on Statistical Reasoning in Science and Society)
by Robert GrantThis is the age of data. There are more innovations and more opportunities for interesting work with data than ever before, but there is also an overwhelming amount of quantitative information being published every day. Data visualisation has become big business, because communication is the difference between success and failure, no matter how clever the analysis may have been. The ability to visualize data is now a skill in demand across business, government, NGOs and academia. Data Visualization: Charts, Maps, and Interactive Graphics gives an overview of a wide range of techniques and challenges, while staying accessible to anyone interested in working with and understanding data. Features: Focusses on concepts and ways of thinking about data rather than algebra or computer code. Features 17 short chapters that can be read in one sitting. Includes chapters on big data, statistical and machine learning models, visual perception, high-dimensional data, and maps and geographic data. Contains more than 125 visualizations, most created by the author. Supported by a website with all code for creating the visualizations, further reading, datasets and practical advice on crafting the images. Whether you are a student considering a career in data science, an analyst who wants to learn more about visualization, or the manager of a team working with data, this book will introduce you to a broad range of data visualization methods. Cover image: Landscape of Change uses data about sea level rise, glacier volume decline, increasing global temperatures, and the increasing use of fossil fuels. These data lines compose a landscape shaped by the changing climate, a world in which we are now living. Copyright © Jill Pelto (jillpelto.com).
Data Visualization: Principles and Practice, Second Edition
by Alexandru C. TeleaDesigning a complete visualization system involves many subtle decisions. When designing a complex, real-world visualization system, such decisions involve many types of constraints, such as performance, platform (in)dependence, available programming languages and styles, user-interface toolkits, input/output data format constraints, integration wi
Data Visualization: Representing Information on Modern Web
by Swizec Teller Simon Timms Andy Kirk Ændrew RininslandUnleash the power of data by creating interactive, engaging, and compelling visualizations for the web About This Book * Get a portable, versatile, and flexible data visualization design approach that will help you navigate the complex path towards success * Get thorough explanation of the many visual variables and visualization taxonomy to provide you with a menu of creative options * A comprehensive and contemporary introduction to data-driven visualization design and the most effective approaches to designing impact-maximizing and cognition-amplifying visualizations Who This Book Is For This course is for developers who are excited about data and who want to share that excitement with others and it will be handy for the web developers or data scientists who want to create interactive visualizations for the web. Prior knowledge of developing web applications is required. You should have a working knowledge of both JavaScript and HTML. What You Will Learn * Harness the power of D3 by building interactive and real-time data-driven web visualizations * Find out how to use JavaScript to create compelling visualizations of social data * Identify the purpose of your visualization and your project's parameters to determine overriding design considerations across your project's execution * Apply critical thinking to visualization design and get intimate with your dataset to identify its potential visual characteristics * Explore the various features of HTML5 to design creative visualizations * Discover what data is available on Stack Overflow, Facebook, Twitter, and Google+ * Gain a solid understanding of the common D3 development idioms * Find out how to write basic D3 code for server using Node.js In Detail Do you want to create more attractive charts? Or do you have huge data sets and need to unearth the key insights in a visual manner? Data visualization is the representation and presentation of data, using proven design techniques to bring alive the patterns, stories, and key insights that are locked away. This learning path is divided into three modules. The first module will equip you with the key techniques required to overcome contemporary data visualization challenges. In the second module, Social Data Visualization with HTML5 and JavaScript, it teaches you how to leverage HTML5 techniques through JavaScript to build visualizations. In third module, Learning d3.js Data Visualization, will lead you to D3, which has emerged as one of the leading platforms to develop beautiful, interactive visualizations over the web. By the end of this course, you will have unlocked the mystery behind successful data visualizations. This Learning Path combines some of the best that Packt has to offer in one complete, curated package. It includes content from the following Packt products: ? Data Visualization: a successful design process by Andy Kirk ? Social Data Visualization with HTML5 and JavaScript by Simon Timms ? Learning d3.js Data Visualization, Second Edition by Ændrew Rininsland and Swizec Teller Style and approach This course includes all the resources that will help you jump into creating interactive and engaging visualizations for the web. Through this comprehensive course, you'll learn how to create engaging visualizations for the web to represent your data from start to finish!
Data Visualization: a successful design process
by Andy KirkA comprehensive yet quick guide to the best approaches to designing data visualizations, with real examples and illustrative diagrams. Whatever the desired outcome ensure success by following this expert design process. This book is for anyone who has responsibility for, or is interested in trying to find innovative and effective ways to visually analyze and communicate data. There is no skill, no knowledge and no role-based pre-requisites or expectations of anyone reading this book.
Data Wrangling with R
by Bradley C. BoehmkeThis guide for practicing statisticians, data scientists, and R users and programmers will teach the essentials of preprocessing: data leveraging the R programming language to easily and quickly turn noisy data into usable pieces of information. Data wrangling, which is also commonly referred to as data munging, transformation, manipulation, janitor work, etc., can be a painstakingly laborious process. Roughly 80% of data analysis is spent on cleaning and preparing data; however, being a prerequisite to the rest of the data analysis workflow (visualization, analysis, reporting), it is essential that one become fluent and efficient in data wrangling techniques.This book will guide the user through the data wrangling process via a step-by-step tutorial approach and provide a solid foundation for working with data in R. The author's goal is to teach the user how to easily wrangle data in order to spend more time on understanding the content of the data. By the end of the book, the user will have learned: How to work with different types of data such as numerics, characters, regular expressions, factors, and datesThe difference between different data structures and how to create, add additional components to, and subset each data structureHow to acquire and parse data from locations previously inaccessibleHow to develop functions and use loop control structures to reduce code redundancyHow to use pipe operators to simplify code and make it more readableHow to reshape the layout of data and manipulate, summarize, and join data sets
Data, Architecture and the Experience of Place
by Anastasia KarandinouThe notion of data is increasingly encountered in spatial, creative and cultural studies. Big data and artificial intelligence are significantly influencing a number of disciplines. Processes, methods and vocabularies from sciences, architecture, arts are borrowed, discussed and tweaked, and new cross-disciplinary fields emerge. More and more, artists and designers are drawing on hard data to interpret the world and to create meaningful, sensuous environments. Architects are using neurophysiological data to improve their understanding of people’s experiences in built spaces. Different disciplines collaborate with scientists to visualise data in different and creative ways, revealing new connections, interpretations and readings. This often demonstrates a genuine desire to comprehend human behaviour and experience and to – possibly – inform design processes accordingly. At the same time, this opens up questions as to why this desire and curiosity is emerging now, how it relates to recent technological advances and how it converses with the cultural, philosophical and methodological context of the disciplines with which it engages. Questions are also raised as to how the use of data and data-informed methods may serve, support, promote and/or challenge political agendas. Data, Architecture and the Experience of Place provides an overview of new approaches on this significant subject and is ideal for students and researchers in digital architecture, architectural theory, design, digital media, sensory studies and related fields.
Data, Matter, Design: Strategies in Computational Design
by Frank MelendezData, Matter, Design presents a comprehensive overview of current design processes that rely on the input of data and use of computational design strategies, and their relationship to an array of outputs. Technological changes, through the use of computational tools and processes, have radically altered and influenced our relationship to cities and the methods by which we design architecture, urban, and landscape systems. This book presents a wide range of curated projects and contributed texts by leading architects, urbanists, and designers that transform data as an abstraction, into spatial, experiential, and performative configurations within urban ecologies, emerging materials, robotic agents, adaptive fields, and virtual constructs. Richly illustrated with over 200 images, Data, Matter, Design is an essential read for students, academics, and professionals to evaluate and discuss how data in design methodologies and theoretical discourses have evolved in the last two decades and why processes of data collection, measurement, quantification, simulation, algorithmic control, and their integration into methods of reading and producing spatial conditions, are becoming vital in academic and industry practices.
Data-Driven Decision Making for Product Service Systems
by Xavier Boucher Giuditta Pezzotta Roberto Sala Marco Bertoni Fabiana PirolaThis book is a compilation of theoretical and practical contributions aimed at facilitating the servitization of manufacturing companies, specifically focusing on data-driven decision-making within the context of Product-Service Systems (PSS). Providing a comprehensive overview, it discusses the latest breakthroughs in operational, tactical, and strategic decision-making for PSS, leveraging data-driven processes, methodologies, and tools. Therefore, the book significantly contributes to strengthening the knowledge on the use of data-driven decision-making methods and tools all the phases of the PSS lifecycle.From extended warranties and leasing to pay-per-use and other innovative configurations, manufacturing companies are increasingly adopting servitized business models and PSS to create additional value for their customers and users and create robust relationships with them, ensuring more reliable cash flows. In this setting, effective information management and the utilization of aggregated operational data have become essential for guiding strategic, tactical, and operational decisions.This book not only consolidates theoretical frameworks but also offers practical insights into data-driven decision-making in PSS, providing deep knowledge on how complex decisions can be taken along the various phases of the PSS lifecycle using data-driven methods and tools. Key areas of focus include: 1. In the Beginning of Life, introducing new services tailored to customer needs, disclosing new business opportunities in terms of revenues, and extending the PSS Middle of Life.2. Designing or re-designing assets and/or services, thereby influencing the PSS Beginning of Life.3. Enhancing daily decisions related to asset management to improve the PSS Middle of Life.4. Optimizing daily decisions related to service delivery and management, aimed at enhancing the PSS Middle of Life.5. Facilitating informed decisions on recycling, remanufacturing, refurbishing, and revamping, impacting the PSS End of Life.This book will be of interest to researchers and managers in industry as it offers insights that bridge the gap between theory and practical application in the evolving landscape of PSS.
Data-Driven Design and Construction
by Randy Deutsch"In this comprehensive book, Professor Randy Deutsch has unlocked and laid bare the twenty-first century codice nascosto of architecture. It is data. Big data. Data as driver. . . This book offers us the chance to become informed and knowledgeable pursuers of data and the opportunities it offers to making architecture a wonderful, useful, and smart art form. " --From the Foreword by James Timberlake, FAIA Written for architects, engineers, contractors, owners, and educators, and based on today's technology and practices, Data-Driven Design and Construction: 25 Strategies for Capturing, Applying and Analyzing Building Data addresses how innovative individuals and firms are using data to remain competitive while advancing their practices. seeks to address and rectify a gap in our learning, by explaining to architects, engineers, contractors and owners--and students of these fields--how to acquire and use data to make more informed decisions. documents how data-driven design is the new frontier of the convergence between BIM and architectural computational analyses and associated tools. is a book of adaptable strategies you and your organization can apply today to make the most of the data you have at your fingertips. Data-Driven Design and Construction was written to help design practitioners and their project teams make better use of BIM, and leverage data throughout the building lifecycle.
Data-Driven Modelling of Non-Domestic Buildings Energy Performance: Supporting Building Retrofit Planning (Green Energy and Technology)
by Saleh Seyedzadeh Farzad Pour RahimianThis book outlines the data-driven modelling of building energy performance to support retrofit decision-making. It explains how to determine the appropriate machine learning (ML) model, explores the selection and expansion of a reasonable dataset and discusses the extraction of relevant features and maximisation of model accuracy. This book develops a framework for the quick selection of a ML model based on the data and application. It also proposes a method for optimising ML models for forecasting buildings energy loads by employing multi-objective optimisation with evolutionary algorithms. The book then develops an energy performance prediction model for non-domestic buildings using ML techniques, as well as utilising a case study to lay out the process of model development. Finally, the book outlines a framework to choose suitable artificial intelligence methods for modelling building energy performances. This book is of use to both academics and practising energy engineers, as it provides theoretical and practical advice relating to data-driven modelling for energy retrofitting of non-domestic buildings.
Data-Driven Smart Community Design: Strategies for Fostering Inclusive and Resilient Neighbourhoods
by Keng Hua ChongThis book couples data analytics with social behavioural studies and participatory design to derive deeper insights on city dwellers’ present needs and future aspirations, thereby enabling the development of targeted spatial and programmatic interventions for diverse communities.Public housing in Singapore has been regarded internationally as a success story. This book outlines the latest strategies and concepts for addressing the emerging social challenges of the ageing population: shrinking household size, increasingly diverse demographics and widening inequality, and fostering inclusive and resilient neighbourhoods. Adopting an interdisciplinary approach, this book: Outlines an innovative data-driven planning process for housing neighbourhood and community design Provides a framework for planners and designers to synthesise qualitative and quantitative data analyses Presents a comprehensive set of tested urban analytics tools, digital platforms and participatory toolkits used to design and develop community initiatives. A recommended text for students undertaking urban planning, urban design, housing design, architecture, real estate, urban sociology and community design, the book’s strategies for evidence-based neighbourhood designs will also appeal to practitioners and policymakers.The Open Access version of this book, available at www.taylorfrancis.com, has been made available under a Creative Commons [Attribution-Non Commercial-No Derivatives (CC-BY-NC-ND)] 4.0 license.
Data-Driven Storytelling (AK Peters Visualization Series)
by Nathalie Henry Riche Christophe Hurter Nicholas Diakopoulos Sheelagh CarpendaleThis book presents an accessible introduction to data-driven storytelling. Resulting from unique discussions between data visualization researchers and data journalists, it offers an integrated definition of the topic, presents vivid examples and patterns for data storytelling, and calls out key challenges and new opportunities for researchers and practitioners.
Data-centric Regenerative Built Environment: Big Data for Sustainable Regeneration (Routledge Research in Sustainable Planning and Development in Asia)
by Saeed Banihashemi Sepideh Zarepour SohiThis book examines the use of big data in regenerative urban environment and how data helps in functional planning and design solutions. This book is one of the first endeavors to present the data-driven methods for regenerative built environments and integrate it with the novel design solutions. It looks at four specific areas in which data is used – urban land use, transportation and traffic, environmental concerns and social issues – and draws on the theoretical literature concerning regenerative built environments to explain how the power of big data can achieve the systematic integration of urban design solutions. It then applies an in-depth case study method on Asian metropolises including Beijing and Tehran to bring the developed innovation into a research-led practical context. This book is a useful reference for anyone interested in driving sustainable regeneration of our urban environments through big data-centric design solutions.
Data-driven Analytics for Sustainable Buildings and Cities: From Theory to Application (Sustainable Development Goals Series)
by Xingxing ZhangThis book explores the interdisciplinary and transdisciplinary fields of energy systems, occupant behavior, thermal comfort, air quality and economic modelling across levels of building, communities and cities, through various data analytical approaches. It highlights the complex interplay of heating/cooling, ventilation and power systems in different processes, such as design, renovation and operation, for buildings, communities and cities. Methods from classical statistics, machine learning and artificial intelligence are applied into analyses for different building/urban components and systems. Knowledge from this book assists to accelerate sustainability of the society, which would contribute to a prospective improvement through data analysis in the liveability of both built and urban environment. This book targets a broad readership with specific experience and knowledge in data analysis, energy system, built environment and urban planning. As such, it appeals to researchers, graduate students, data scientists, engineers, consultants, urban scientists, investors and policymakers, with interests in energy flexibility, building/city resilience and climate neutrality.
Database and Expert Systems Applications: DEXA 2019 International Workshops BIOKDD, IWCFS, MLKgraphs and TIR, Linz, Austria, August 26–29, 2019, Proceedings (Communications in Computer and Information Science #1062)
by Mourad Elloumi Ismail Khalil A Min Tjoa Atif Mashkoor Anna Fensel Xabier Larrucea Michael Granitzer Christin Seifert Benno Stein Gabriele Anderst-Kotsis Johannes Sametinger Bernhard Moser Jorge Martinez-GilThis volume constitutes the refereed proceedings of the four workshops held at the 30th International Conference on Database and Expert Systems Applications, DEXA 2019, held in Linz, Austria, in August 2019: The 10th International Workshop on Biological Knowledge Discovery from Data, BIOKDD 2019, the 3rd International Workshop on Cyber-Security and Functional Safety in Cyber-Physical Systems, IWCFS 2019, the 1st International Workshop on Machine Learning and Knowledge Graphs, MLKgraphs2019, and the 16th International Workshop on Technologies for Information Retrieval, TIR 2019. The 26 selected papers discuss a range of topics including: knowledge discovery, biological data, cyber security, cyber-physical system, machine learning, knowledge graphs, information retriever, data base, and artificial intelligent.
Datenvisualisierung mit R: 111 Beispiele
by Thomas RahlfDieses Buch f#65533;hrt in die Grundlagen der Gestaltung von Pr#65533;sentationsgrafiken mit der Open Source Software R ein, die hinsichtlich der Visualisierungsm#65533;glichkeiten praktisch keine W#65533;nsche offen l#65533;sst und sich zunehmend als Standard im Bereich der Statistiksoftware etabliert. Anhand von 111 vollst#65533;ndigen Skript-Beispielen lernen Sie, wie Sie Balken- und S#65533;ulendiagramme, Bev#65533;lkerungspyramiden, Lorenzkurven, Streudiagramme, Zeitreihendarstellungen, Radialpolygone, Gantt-Diagramme, Profildiagramme, Heatmaps, Bumpcharts, Mosaik- und Ballonplots sowie eine Reihe verschiedener thematischer Kartentypen mit dem Base Graphics System von R erstellen. F#65533;r jedes Beispiel werden reale Daten verwendet sowie die Abbildung und deren Programmierung Schritt f#65533;r Schritt erl#65533;utert. Das Buch ist damit ein wertvolles Nachschlagewerk f#65533;r eine F#65533;lle von Anwendungsf#65533;llen der Datenvisualisierung, zu deren traditionellen Anwendungsbereichen in Wissenschaft und Marketing vermehrt auch neue Gebiete wie Big- Data-Analysen oder Datenjournalismus hinzukommen. In der vorliegenden Auflage wurden Beispiele zu Cartogrammen, Chord-Diagrammen und Netzwerken sowie ein neues Kapitel zu interaktiven Visualisierungen mit Javascript aufgenommen. Der Autor Thomas Rahlf arbeitet als Direktor in der Gruppe Qualit#65533;ts- und Verfahrensmanagement bei der Deutschen Forschungsgemeinschaft und ist Lehrbeauftragter an der Universit#65533;t Bonn. Er hat #65533;ber Methodologien der Statistik und #65533;konometrie promoviert, ist Mitglied im Editorial Board der Zeitschrift Cliometrica und Herausgeber einer Historischen Statistik von Deutschland. Den Themen Open Source, Datendesign und -visualisierung gilt seit vielen Jahren sein Interesse.
Datenvisualisierungen mit Julia: Erstellen von Grafiken, interaktiver Oberflächen sowie Animationen
by Daniel JaudDieses Buch stellt eine Einführung in das Programmieren und das Erstellen publikationsfertiger Grafiken oder interaktiver Animationen mit der Julia-Programmiersprache dar. Ein besonderes Augenmerk liegt dabei auf einer schrittweise Auseinandersetzung mit den verschiedenen Plot-Möglichkeiten. Im Buch werden aufeinander aufbauend alle wichtigen Programmierkonstrukte zum Erstellen von Grafiken ausgearbeitet. Durch zusätzliche Aufgaben mit Beispiellösungen kann der Leser sein gelerntes Wissen nochmals selbst in der Praxis anwenden.Der InhaltErste SchritteSchleifen in JuliaErstellen einfacher GrafikenDarstellungsoptionen von Plots und Schleifen mit FunktionenVektorfelder, 3d-Plots, Oberflächen und KonturenInteraktive Anwendungen und AnimationenDer AutorDr. Daniel Jaud studierte Mathematik und Physik mit anschließender Promotion. Er unterrichtet an einem Gymnasium und ist weiterhin als freier Wissenschaftler im Bereich der mathematischen Physik tätig.
Dating Buildings and Landscapes with Tree-Ring Analysis: An Introduction with Case Studies
by Christopher Baas Darrin L. RubinoThis book presents guidance, theory, methodologies, and case studies for analyzing tree rings to accurately date and interpret historic buildings and landscapes. Written by two long-time practitioners in the field of dendrochronology, the research is grounded in the fieldwork data of approximately 200 structures and landscapes. By scientifically analyzing the tree rings of historic timbers, preservationists can obtain valuable information about construction dates, interpret the evolution of landscapes and buildings over time, identify species and provenance, and gain insight into the species matrix of local forests. Authors Darrin L. Rubino and Christopher Baas demonstrate, through full-color illustrated case studies and methodologies, how this information can be used to interpret the history of buildings and landscapes and assist preservation decision-making. Over 1,000 samples obtained from more than 40 buildings, including high style houses, vernacular log houses, and timber frame barns, are reported. This book will be particularly relevant for students, instructors, and professional readers interested in historic preservation, cultural landscapes, museum studies, archaeology, and dendrochronology globally.
Daufuskie Island: Smokin' Joe Butter Beans, Ol' 'fuskie Fried Crab Rice, Sticky-bush Blackberry Dumpling, And Other Sea Island Favorites (Images of America)
by Sallie Ann Robinson Jenny HerschDaufuskie, a Muscogee word meaning "sharp feather" or "land with a point," is an island located between Hilton Head and Savannah, bounded by the Calibogue Sound and the Cooper River. With no bridge to the mainland, the island maintains a distinct allure. Home to Native American tribes, a paradise for pirates, and a strategic military outpost, Daufuskie held enslaved Africans brought by plantation owners as chattel to build their wealth. After the Civil War and occupation by Union soldiers, freed slaves from the Sea Islands and surrounding states settled on Daufuskie as landowners and sharecroppers. Daufuskie's population fluctuated in keeping with local industries, and those who stayed often relied on farming, hunting, and fishing to survive. Electricity was brought to the island in the early 1950s, and the first telephone rang in 1972. Today, historic sites, restaurants, outdoor recreation, and scenic beauty draw visitors and residents to this unique community. Daufuskie Island is part of the National Park Service's Gullah Geechee Cultural Heritage Corridor and is listed in the National Register of Historic Places.
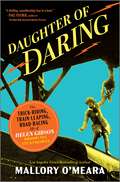
Daughter of Daring: The Trick-Riding, Train-Leaping, Road-Racing Life of Helen Gibson, Hollywood’s First Stuntwoman
by Mallory O'MearaFrom Los Angeles Times bestselling author Mallory O'Meara, the exhilarating story of America's first professional stuntwoman, Helen Gibson, who worked during a time when women ruled Hollywood Helen Gibson was willing to do anything to give audiences a thrill. Advertised as &“The Most Daring Actress in Pictures,&” Helen emerged in the early days of the twentieth-century silent film scene as a rodeo rider, producer, performer and stunt double for iconic stars of the era. Her exploits were as dangerous as they were glamorous, featured in hundreds of films and serials—yet her legacy was quickly overshadowed by the increasingly hypermasculine and male-dominated evolution of action films in the decades that would follow her. In this fast-paced and feminist biography, award-winning author Mallory O'Meara presents Helen&’s life and career in exhilarating detail, including:• Helen&’s rise to fame in The Hazards of Helen, the longest-running serial in history • How Helen became the first-ever stuntwoman in American film • The pivotal and overlooked role of Helen&’s contemporaries—including female directors, stars and stuntwomen who shaped the making of narrative film. Through the page-turning story of Helen&’s pioneering legacy, Mallory O'Meara gives readers a glimpse of the Golden Age of Hollywood that could have been: an industry where women call the shots.
