- Table View
- List View
Dance and Organization: Integrating Dance Theory and Methods into the Study of Management (Routledge Studies in Management, Organizations and Society)
by Brigitte BiehlDance and Organisation is the first comprehensive work to integrate dance theory and methods into the study of management, which have developed an interest in the arts and the humanities. Dance represents dynamics and change and puts the moving body at the centre, which has been ignored and oppressed by traditional management theory. ‘Being’ a leader however also means to ‘move’ like one, and critical lessons can be learned from ballerinas and modern dancers. Leadership is a dialogue, as in the work of musicians, conductors and DJs who manage groups without words. Movement in organisational space, in a museum or a techno club can be understood as a choreography and site-specific performance. Movement also is practically used for leadership and employee development workshops and can be deployed as an organisational research method. By taking a firm interdisciplinary stance in dance studies and organisational research to explore management topics, reflecting on practitioner accounts and research projects, the book seeks to make an innovative contribution to our understanding of the moving body, generating new insights on teamwork, leadership, gender in management, organisational space, training and research methods. It comprises an important contribution to the organizational behaviour and critical management studies disciplines, and looks to push the boundaries of the academic literature.
Dance, Consumerism, and Spirituality
by C. S. WalterDance has proliferated in movies, television, Internet, and retail spaces while the spiritual power of dance has also been linked with mass consumption. Walter marries the cultural studies of dance and the religious aspects of dance in an exploration of consumption rituals, including rituals of being persuaded to buy products that include dance.
Dance Leadership: Theory Into Practice
by Jane M. AlexandreThis "what is"--rather than "how to"-- volume proposes a theoretical framework for understanding dance leadership for dancers, leaders, and students of both domains, illustrated by portraits of leaders in action in India, South Africa, UK, US, Brazil and Canada. What is dance leadership? Who practices it, in what setting, and why? Through performance, choreography, teaching, writing, organizing and directing, the dance leaders portrayed herein instigate change and forward movement. Illustrating all that is unique about leading in dance, and by extension the other arts, readers can engage with such wide-ranging issues as: Does the practice of leading require followers? How does one individual's dance movement act on others in a group? What does 'social engagement' mean for artists? Is the pursuit of art and culture a human right?
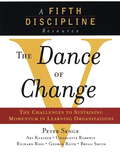
The Dance of Change
by Peter M. SengeSince Peter Senge published his groundbreaking book The Fifth Discipline, he and his associates have frequently been asked by the business community: "How do we go beyond the first steps of corporate change? How do we sustain momentum?" They know that companies and organizations cannot thrive today without learning to adapt their attitudes and practices. But companies that establish change initiatives discover, after initial success, that even the most promising efforts to transform or revitalize organizations--despite interest, resources, and compelling business results--can fail to sustain themselves over time. That's because organizations have complex, well-developed immune systems, aimed at preserving the status quo.Now, drawing upon new theories about leadership and the long-term success of change initiatives, and based upon twenty-five years of experience building learning organizations, the authors of The Fifth Discipline Fieldbook show how to accelerate success and avoid the obstacles that can stall momentum. The Dance of Change, written for managers and executives at every level of an organization, reveals how business leaders can work together to anticipate the challenges that profound change will ultimately force the organization to face. Then, in a down-to-earth and compellingly clear format, readers will learn how to build the personal and organizational capabilities needed to meet those challenges.These challenges are not imposed from the outside; they are the product of assumptions and practices that people take for granted--an inherent, natural part of the processes of change. And they can stop innovation cold, unless managers at all levels learn to anticipate them and recognize the hidden rewards in each challenge, and the potential to spur further growth. Within the frequently encountered challenge of "Not Enough Time," for example--the lack of control over time available for innovation and learning initiatives--lies a valuable opportunity to reframe the way people organize their workplaces.This book identifies universal challenges that organizations ultimately find themselves confronting, including the challenge of "Fear and Anxiety"; the need to diffuse learning across organizational boundaries; the ways in which assumptions built in to corporate measurement systems can handcuff learning initiatives; and the almost unavoidable misunderstandings between "true believers" and nonbelievers in a company.Filled with individual and team exercises, in-depth accounts of sustaining learning initiatives by managers and leaders in the field, and well-tested practical advice, The Dance of Change provides an insider's perspective on implementing learning and change initiatives at such corporations as British Petroleum, Chrysler, Dupont, Ford, General Electric, Harley-Davidson, Hewlett-Packard, Mitsubishi Electric, Royal DutchShell, Shell Oil Company, Toyota, the United States Army, and Xerox. It offers crucial advice for line-level managers, executive leaders, internal networkers, educators, and others who are struggling to put change initiatives into practice.
The Dance of Change: The Challenges of Sustaining Momentum in Learning Organizations (A Fifth Discipline Resource)
by Bryan Smith Art Kleiner Peter M. Senge Charlotte Roberts Richard Ross Geroge RothThe Dance of Change offers exercises, tools and techniques for sustaining organisational learning over the long term, as well as suggestions, advice, cautions and warnings based on the experience of people who have already followed the path suggested by the author in The Fifth Discipline. The central message of the text is that learning is the only sustainable competitive advantage.
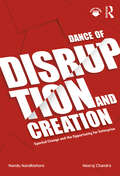
Dance of Disruption and Creation: Epochal Change and the Opportunity for Enterprise
by Nandu Nandkishore Neeraj ChandraIt’s an exciting time to be alive! We are witness to an epoch of change, a dance of disruption and creation, that is re-imagining our world. Where are these disruptions coming from? What opportunities do they uncover? How can one make sense of them? And most importantly, how should one prepare and act? This book, written by two influential business leaders, unpacks these "epochal" changes and how they represent a defining moment of opportunity for the world of business. Nandu Nandkishore and Neeraj Chandra draw upon diverse sources, academic literature, discussions with CEOs, startup founders and experts, in order to understand the significant pivots of change emerging from a wide canvas and then stitch together a perspective of an exciting, brave new world. Unlike many other books that focus only on emerging technologies, the authors here look at disruption through several lenses: technology, demographics, economic change, the changing nature of institutions, and the interplay of technology as it fundamentally shapes consumers and society. The book goes beyond describing changes taking place. It explores the "why so" and "so what" to provide an understanding of the shifts taking place, and crucially, the implications for the world of enterprise. Using simple examples and frameworks throughout, the book provides specific, action-oriented solutions that businesses can employ. This book will be of specific interest to business leaders, strategists, investment professionals, as well as social scientists and public servants. It is for change-makers who are excited to seize the unique opportunity that this change represents – to build competitive advantage, re-invent markets and enterprise, and indeed, to make the world a better place. A selection of reference links and material for the book is accessible at www.routledge.com/9781032184791.
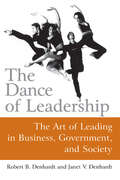
The Dance of Leadership: The Art of Leading in Business, Government, and Society
by Janet V DenhardtMost successful leaders know that leadership is an art, not a science. They recognize that beyond all the sophisticated systems and theories, the strategies and tactics, leadership is ultimately about intangible things such as timing, intuition, and passion This book shows how successful leaders can master the artistic aspects of their work. It guides readers to the ways that the leadership can be practiced and learned. "The Dance of Leadership" explores the art of leadership by examining the perspectives, training, and insights of artists, most particularly in the fields of music and dance. The authors look at how these people learn their craft, practice their skills, and attain mastery of their art. Then they adapt these lessons from the arts to the experiences of successful leaders in all fields. This book incorporates in-depth interviews with some of the world's premier artists and writers, as well as dozens of leader business, government, the military, and sports. The result is a book that celebrates the art of leadership - but an art that can learned, developed, and practiced.
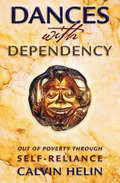
Dances with Dependency: Out of Poverty Through Self-Reliance
by Calvin HelinDances with Dependency offers effective strategies to eliminate welfare dependency and help eradicate poverty among indigenous populations. Beginning with an impassioned and insightful portrait of today&’s native communities, it connects the prevailing impoverishment and despair directly to a &“dependency mindset&” forged by welfare economics. To reframe this debilitating mindset, it advocates policy reform in conjunction with a return to native peoples&’ ten-thousand-year tradition of self-reliance based on personal responsibility and cultural awareness. Author Calvin Helin, un-tethered to agendas of political correctness or partisan politics, describes the mounting crisis as an impending demographic tsunami threatening both the United States and Canada. In the United States, where government entitlement programs for diverse ethnic minorities coexist with an already huge national debt, he shows how prosperity is obviously at stake. This looming demographic tidal wave viewed constructively, however, can become an opportunity for reform—among not only indigenous peoples of North America but any impoverished population struggling with dependency in inner cities, developing nations, and post-totalitarian countries.
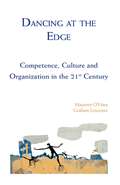
Dancing At The Edge: Competence, Culture And Organization In The 21st Century
by Maureen O'Hara Graham Leicester Jennifer WilliamsIn his 1980 essay, The World of Tomorrow and the Person of Tomorrow, the psychologist Carl Rogers contemplated the future. He described those who would usher in this new era as people with the capacity to understand, bring about and absorb a paradigm shift. He added: "I have an uneasy feeling about this chapter... It is a beginning, an outline, a suggestion... I believe that what I am saying here will some day be fleshed out much more fully, either by me or someone else." Maureen O'Hara and Graham Leicester are uniquely qualified fleshers-out. They draw on their own extensive research and practical experience observing some of today's most successful cultural, political and business leaders to explore the competencies that can best help us navigate the 'blooming, buzzing confusion' of the 21st century. They conclude that these are innate and within reach of all of us - given the right setting, plenty of practice and some gentle guidance. But they are seldom seen because they are routinely undervalued in today's culture. That must change, the authors insist, and this book is intended to begin that change. Theodore Hesburgh, President Emeritus of Notre Dame University, once said that leadership demands certainty: "You cannot blow an uncertain trumpet." On the contrary, argue Leicester and O'Hara, we must all learn to play the uncertain trumpet like virtuosos. It is an image that conveys the subtle discipline required of 'persons of tomorrow.' "They are the people already among us who inhabit the complex and messy problems of the 21st century in a more expansive way than their colleagues... They dance at the edge."
Dancing Through Complexity: Shaping Resolutions by Resisting Simplification
by Roger L. MartinThis chapter identifies how the twin forces of simplification and specialization-hallmarks of modern life and business-discourage integrative thinking, and describes how these forces can be countered.
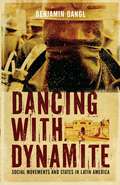
Dancing with Dynamite
by Benjamin DanglGrassroots social movements played a major role electing left-leaning governments throughout Latin America. Subsequent relations between these states and "the streets" remain troubled. Contextualizing recent developments historically, Dangl untangles the contradictions of state-focused social change, providing lessons for activists everywhere.
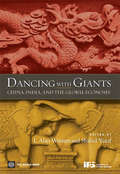
Dancing with Giants: China, India, and the Global Economy
by Shahid Yusuf Alan WintersChina is now the world's fourth largest economy and growing very fast. India's economic salience is also on the rise. Together these two countries will profoundly influence the pace and nature of global economic change. Drawing upon the latest research, this volume analyzes the influences on the rapid future development of these two countries and examines how their growth is likely to impinge upon other countries. It considers international trade, industrialization, foreign investment and capital flows, and the implications of their broadening environmental footprints. It also discusses how the two countries have tackled poverty, inequality and governance issues and whether progress in these areas will be a key to rapid and stable growth.
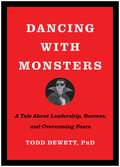
Dancing with Monsters: A Tale About Leadership, Success, and Overcoming Fears
by Todd DewettIs fear limiting your leadership potential? Dancing with Monsters will inspire you to overcome your fears and optimize your key relationships by leveraging humility, authenticity, and kindness. Fears and discomfort slow us down and sometimes completely derail our personal progress. As leaders at work, we can similarly be knocked off course by the conflict, personality differences, motivational issues, and performance problems within our teams. These obstacles are the monsters in our lives. In Dancing with Monsters, globally recognized leadership educator, author, and speaker Todd Dewett, PhD, offers an enthralling, fast-paced fable that examines how to embrace those monsters in order to harness you and your team&’s true power. Joe is a depressed vampire at risk of losing his monster status due to poor performance. He is tasked with leading a group of misfit monsters who lack confidence. Sheets, Mum, Wolfy, and Z have not yet learned to do the one thing all monsters do: scare kids. Dancing with Monsters tells the story of their collective efforts, missteps included, toward connecting with their authentic selves. This captivating story plus Dewett&’s discussion and reflection prompts add up to a must-read guide to reclaiming your better self by learning to dance with your monsters.
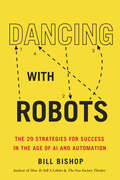
Dancing With Robots: The 29 Strategies for Success In the Age of AI and Automation
by Bill BishopSurvive and thrive in a world being taken over by robots and other advanced technology. Artificial intelligence, machine learning, algorithms, blockchains, the Internet of Things, big data analytics, 5G networks, self-driving cars, robotics, 3D printing. In the coming years, these technologies, and others to follow, will have a profound and dramatically disruptive impact on how we work and live. Whether we like it or not, we need to develop a good working relationship with these technologies. We need to know how to “dance” with robots. In Dancing with Robots, futurist, entrepreneur, and innovation coach Bill Bishop describes 29 strategies for success in the New Economy. These new strategies represent a bold, exciting, unexpected, and radically different road map for future success.Bishop also explains how our Five Human Superpowers — embodied pattern recognition, unbridled curiosity, purpose-driven ideation, ethical framing, and metaphoric communication — give us a competitive edge over robots and other advanced technology in a world being taken over by automation and AI.
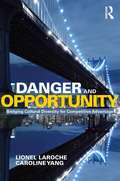
Danger and Opportunity: Bridging Cultural Diversity for Competitive Advantage
by Lionel Laroche Caroline YangThe Chinese characters for "danger" and "opportunity" form the word "crisis". Ancient Chinese wisdom sees an opportunity in danger. While cultural diversity brings challenges to the workplace, how do we turn these challenges into opportunities? Drawing on their extensive experience working with multicultural and multinational organizations, Lionel Laroche and Caroline Yang provide an in-depth analysis of cross-cultural dynamics in the workplace and offer practical suggestions at both the individual and organizational levels. The book analyzes cross-cultural challenges in six areas: the relative importance of technical and soft skills; cross-cultural communication; cross-cultural feedback; hierarchy; individualism; and risk tolerance. It then provides a solutions framework that encompasses people, systems and environment to bridge the issues that arise from cultural differences. The analysis and solutions are applied in four business contexts: managing a multicultural workforce; competing in the global talent market; collaborating with joint venture partners; and working with offshore resources. If you work with colleagues, managers, employees and customers from diverse cultures, if you are with an organization that has a multicultural workforce and/or global operations, or if your organization collaborates with joint venture partners or offshore resources from different cultures, then Danger and Opportunity: Bridging Cultural Diversity for Competitive Advantage is the book for you.
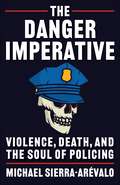
The Danger Imperative: Violence, Death, and the Soul of Policing
by Michael Sierra-ArévaloPolicing is violent. And its violence is not distributed equally: stark racial disparities persist despite decades of efforts to address them. Amid public outcry and an ongoing crisis of police legitimacy, there is pressing need to understand not only how police perceive and use violence but also why.With unprecedented access to three police departments and drawing on more than 100 interviews and 1,000 hours on patrol, The Danger Imperative provides vital insight into how police culture shapes officers’ perception and practice of violence. From the front seat of a patrol car, it shows how the institution of policing reinforces a cultural preoccupation with violence through academy training, departmental routines, powerful symbols, and officers’ street-level behavior.This violence-centric culture makes no explicit mention of race, relying on the colorblind language of “threat” and “officer safety.” Nonetheless, existing patterns of systemic disadvantage funnel police hyperfocused on survival into poor minority neighborhoods. Without requiring individual bigotry, this combination of social structure, culture, and behavior perpetuates enduring inequalities in police violence.A trailblazing, on-the-ground account of modern policing, this book shows that violence is the logical consequence of an institutional culture that privileges officer survival over public safety.
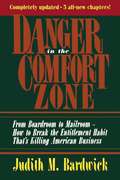
Danger in the Comfort Zone: From Boardroom to Mailroom -- How to Break the Entitlement Habit That's Killing American Business
by Judith M. BardwickDanger in the Comfort Zone examines the phenomenon of the "entitlement" mentality in the American workforce -- people's preoccupation with their rewards rather than their responsibilities. Bardwick describes three basic mindsets and shows the effect of each on individuals and their organizations: * Entitlement -- people feel entitled to rewards and lethargic about having to earn them; motivation and job satisfaction are low * Fear -- people are paralyzed; the threat of layoffs makes them focus on protecting their jobs rather than doing them well * Earning -- people are energized by challenge; they know their accomplishments will be noticed -- and rewarded In this paperback edition, Bardwick points out that although the "fear" element has undoubtedly grown in the last few years, the entitlement attitude is still firmly entrenched at all levels. She offers additional chapters with new, specific techniques for pulling people out of the quagmire of fear and complacency, and igniting them with the energy of true earning.
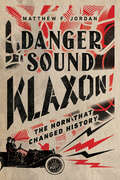
Danger Sound Klaxon!: The Horn That Changed History
by Matthew F. JordanDanger Sound Klaxon! reveals the untold story of the Klaxon automobile horn, one of the first great electrical consumer technologies of the twentieth century. Although its metallic shriek at first shocked pedestrians, savvy advertising strategies convinced consumers across the United States and western Europe to adopt the shrill Klaxon horn as the safest signaling technology available in the 1910s. The widespread use of Klaxons in the trenches of World War I, however, transformed how veterans heard this car horn, and its traumatic association with gas attacks ultimately doomed this once ubiquitous consumer technology.By charting the meteoric rise and eventual fall of the Klaxon, Matthew Jordan highlights how perceptions of sound-producing technologies are guided by, manipulated, and transformed through advertising strategies, public debate, consumer reactions, and governmental regulations. Jordan demonstrates in this fascinating history how consumers are led toward technological solutions for problems themselves created by technology.
Dangerous and Dishonest Men: The International Bankers Of Louis Xiv's France (Palgrave Studies in the History of Finance)
by G. RowlandsAt the start of the eighteenth century Louis XIV needed to remit huge sums of money abroad to support his armies during the War of the Spanish Succession. This book explains how international bankers moved French money across Europe, and how the foreign exchange system was so overloaded by the demands of war that a massive banking crash resulted.
Dangerous Business: The Risks of Globalization for America
by Pat ChoateFrom one of the most respected and vigorous economic thinkers in Washington, a wake-up call about the perils of unfettered globalization. In this impassioned, prescient book, Pat Choate shows us that while increased worldwide economic integration has some benefits for our fiscal efficiency, it also creates dependencies, vulnerabilities, national security risks, and social costs that now outweigh its advantages. He takes the long view of developments such as technology-driven progress, the offshoring of jobs, and open trade, arguing that current U.S. policies are leading to worldwide economic and political instability, in much the same way as before the Great Depression.Choate writes convincingly about the Defense Department&’s growing dependence on foreign sources for its technologies, the leasing of parts of our interstate highway system to overseas investors, China&’s economic mercantilism, and international currency manipulation that damages the dollar. We have been borrowing heavily from foreign lenders, who by 2009 will own more than half of the Treasury debt, a third of U.S. corporate bonds, and a sixth of U.S. corporate assets—all of which, if handled improperly, could trigger a global economic collapse.But our economic forecast need not be dire. Choate sees a way out of these dilemmas and presents politically viable steps the United States can take to remain sovereign, prosperous, and secure. He presents bold new research that identifies the special interests and structural corruption that have overtaken our democracy—and shows how they can be corrected. He illustrates how our policy-making and legislative process, currently beholden to the highest bidder, can be transformed from one of corporatism and elitism into one of greater transparency. Clear-eyed and persuasive, this is sure to be one of the most widely discussed books of the year.
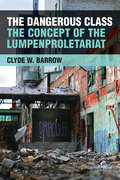
The Dangerous Class: The Concept of the Lumpenproletariat
by Clyde BarrowMarx and Engels’ concept of the “lumpenproletariat,” or underclass (an anglicized, politically neutral term), appears in The Communist Manifesto and other writings. It refers to “the dangerous class, the social scum, that passively rotting mass thrown off by the lowest layers of old society,” whose lowly status made its residents potential tools of the capitalists against the working class. Surprisingly, no one has made a substantial study of the lumpenproletariat in Marxist thought until now. Clyde Barrow argues that recent discussions about the downward spiral of the American white working class (“its main problem is that it is not working”) have reactivated the concept of the lumpenproletariat, despite long held belief that it is a term so ill-defined as not to be theoretical. Using techniques from etymology, lexicology, and translation, Barrow brings analytical coherence to the concept of the lumpenproletariat, revealing it to be an inherent component of Marx and Engels’ analysis of the historical origins of capitalism. However, a proletariat that is destined to decay into an underclass may pose insurmountable obstacles to a theory of revolutionary agency in post-industrial capitalism. Barrow thus updates historical discussions of the lumpenproletariat in the context of contemporary American politics and suggests that all post-industrial capitalist societies now confront the choice between communism and dystopia.
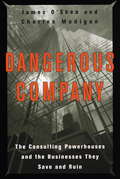
Dangerous Company: The Consulting Powerhouses and the Businesses They Save and Ruin
by Charles MadiganDangerous Company chronicles the successes, failures, and practices of the biggest and most influential firms in the consulting industry. O'Shea and Madigan chronicle such stories as the one involving the consultant who provided state's evidence and landed his client behind bars, the Fortune 500 company that was billed over $75 million in consulting fees yet was left on the brink of bankruptcy, and the role played by consultants in the rejuvenation of Sears.From the Hardcover edition.
Dangerous Gifts: Gender and Exchange in Ancient Greece
by Deborah LyonsDeianeira sends her husband Herakles a poisoned robe. Eriphyle trades the life of her husband Amphiaraos for a golden necklace. Atreus’s wife Aerope gives away the token of his sovereignty, a lamb with a golden fleece, to his brother Thyestes, who has seduced her. Gifts and exchanges always involve a certain risk in any culture, but in the ancient Greek imagination, women and gifts appear to be a particularly deadly combination. This book explores the role of gender in exchange as represented in ancient Greek culture, including Homeric epic and tragedy, non-literary texts, and iconographic and historical evidence of various kinds. Using extensive insights from anthropological work on marriage, kinship, and exchange, as well as ethnographic parallels from other traditional societies, Deborah Lyons probes the gendered division of labor among both gods and mortals, the role of marriage (and its failure) in transforming women from objects to agents of exchange, the equivocal nature of women as exchange-partners, and the importance of the sister-brother bond in understanding the economic and social place of women in ancient Greece. Her findings not only enlarge our understanding of social attitudes and practices in Greek antiquity but also demonstrate the applicability of ethnographic techniques and anthropological theory to the study of ancient societies.
