- Table View
- List View
Steganography Techniques for Digital Images
by Abid YahyaThis book covers newly developed and novel Steganography techniques and algorithms. The book outlines techniques to provide security to a variety of applications using Steganography, with the goal of both hindering an adversary from decoding a hidden message, and also preventing an adversary from suspecting the existence of covert communications. The book looks into applying these newly designed and improved algorithms to provide a new and efficient Steganographic system, called Characteristic Region-Based Image Steganography (CR-BIS). The algorithms combine both the robustness of the Speeded-Up Robust Features technique (SURF) and Discrete Wavelet Transform (DWT) to achieve characteristic region Steganography synchronization. The book also touches on how to avoid hiding data in the whole image by dynamically selecting characteristic regions for the process of embedding. Applies and discusses innovative techniques for hiding text in a digital image file or even using it as a key to the encryption;Provides a variety of methods to achieve characteristic region Steganography synchronization;Shows how Steganography improves upon cryptography by using obscurity features.
STEM Education for the 21st Century (Springerbriefs In Education Ser.)
by Bryan Edward PenpraseThis book chronicles the revolution in STEM teaching and learning that has arisen from a convergence of educational research, emerging technologies, and innovative ways of structuring both the physical space and classroom activities in STEM higher education. Beginning with a historical overview of US higher education and an overview of diversity in STEM in the US, the book sets a context in which our present-day innovation in science and technology urgently needs to provide more diversity and inclusion within STEM fields. Research-validated pedagogies using active learning and new types of research-based curriculum is transforming how physics, biology and other fields are taught in leading universities, and the book gives profiles of leading innovators in science education and examples of exciting new research-based courses taking root in US institutions. The book includes interviews with leading scientists and educators, case studies of new courses and new institutions, and descriptions of site visits where new trends in 21st STEM education are being developed. The book also takes the reader into innovative learning environments in engineering where students are empowered by emerging technologies to develop new creative capacity in their STEM education, through new centers for design thinking and liberal arts-based engineering. Equally innovative are new conceptual frameworks for course design and learning, and the book explores the concepts of Scientific Teaching, Backward Course Design, Threshold Concepts and Learning Taxonomies in a systematic way with examples from diverse scientific fields. Finally, the book takes the reader inside the leading centers for online education, including Udacity, Coursera and EdX, interviews the leaders and founders of MOOC technology, and gives a sense of how online education is evolving and what this means for STEM education. This book provides a broad and deep exploration into the historical context of science education and into some of the cutting-edge innovations that are reshaping how leading universities teach science and engineering. The emergence of exponentially advancing technologies such as synthetic biology, artificial intelligence and materials sciences has been described as the Fourth Industrial Revolution, and the book explores how these technologies will shape our future will bring a transformation of STEM curriculum that can help students solve many the most urgent problems facing our world and society.
STEM in the Technopolis: The Power of STEM Education in Regional Technology Policy
by Cliff Zintgraff Sang C. Suh Bruce Kellison Paul E. RestaThis book addresses how forward-thinking local communities are integrating pre-college STEM education, STEM pedagogy, industry clusters, college programs, and local, state and national policies to improve educational experiences, drive local development, gain competitive advantage for the communities, and lead students to rewarding careers. This book consists of three sections: foundational principles, city/regional case studies from across the globe, and state and national context. The authors explore the hypothesis that when pre-college STEM education is integrated with city and regional development, regions can drive a virtuous cycle of education, economic development, and quality of life.Why should pre-college STEM education be included in regional technology policy? When local leaders talk about regional policy, they usually talk about how government, universities and industry should work together. This relationship is important, but what about the hundreds of millions of pre-college students, taught by tens of millions of teachers, supported by hundreds of thousands of volunteers, who deliver STEM education around the world? Leaders in the communities featured in STEM in the Technopolis have recognized the need to prepare students at an early age, and the power of real-world connections in the process. The authors advocate for this approach to be expanded. They describe how STEM pedagogy, priority industry clusters, cross-sector collaboration, and the local incarnations of global development challenges can be made to work together for the good of all citizens in local communities. This book will be of interest to government policymakers, school administrators, industry executives, and non-profit executives. The book will be useful as a reference to teachers, professors, industry professional volunteers, non-profit staff, and program leaders who are developing, running, or teaching in STEM programs or working to improve quality of life in their communities.
STEM Learning
by Elsayed A. Orady Daniel B. Lawson Brahim Medjahed Margret Höft Mesut DuranThis book reports the results of a three-year research program funded by the National Science Foundation which targeted students and teachers from four Detroit high schools in order for them to learn, experience, and use IT within the context of STEM (IT/STEM), and explore 21st century career and educational pathways. The book discusses the accomplishment of these goals through the creation of a Community of Designers-- an environment in which high school students and teachers, undergraduate/graduate student assistants, and STEM area faculty and industry experts worked together as a cohesive team. The program created four project-based design teams, one for each STEM area. Each team had access to two year-round IT/STEM enrichment experiences to create high-quality learning projects, strategies, and curriculum models. These strategies were applied in after school, weekend, and summer settings through hands-on, inquiry-based activities with a strong emphasis on non-traditional approaches to learning and understanding. The book represents the first comprehensive description and analysis of the research program and suggests a plan for future development and refinement.
STEM Learning in Extended Reality: Research, Design, and Examples (Synthesis Lectures on Engineering, Science, and Technology)
by Ferdinand RiveraThis book synthesizes findings from recent and ongoing research on the use of Extended Reality (XR) to support learning of STEM content. XR is slowly being introduced in classrooms due to significant changes in XR technology. These tools were historically costly, unfriendly, and developed only for gamers. Today, XR tools are able to enhance students’ immersive experiences in such settings. In classrooms, in particular, they provide learners with an opportunity to manipulate abstract objects as if they are physical objects. The book begins with an extensive and detailed description and evaluation of the impact of various XR interventions on learning and engagement in STEM classrooms. The author then concludes with theoretical frameworks for investigating learning in computer- immersive contexts and practical implications for effectively using XR tools to learn STEM.
STEM Problems with Mathcad and Python
by Valery Ochkov Alan Stevens Anton TikhonovSTEM Problems with Mathcad and Python seeks to remove the fear of tackling difficult scientific and technical calculations for future mathematicians, engineers, scientists, and other STEM researchers. The authors hope to show that such calculations can be not only useful, but that the process of learning how to do them can be enjoyable, especially with the help of Mathcad and Python programming skills. The book will also illustrate how the use of modern computer software allows one to significantly expand the range of problems considered beyond those conventionally taught. This includes computational experiments, multivariate calculations, inverse problems and optimization problems, with both static and animated visual feedback. Features Suitable for undergraduates and early postgraduates who need simple and accessible guidance for solving practical interdisciplinary technical problems Can be used as an additional textbook in a variety of topics, including Calculus, Linear Algebra, Analytical Geometry, Discrete Mathematics, Computer Science, Computational Mathematics, Scientific Visualization, Computer Graphics Gives computer users access to an exciting new hobby - solving complex problems described in fiction.
STEM Teachers and Teaching in the Digital Era: Professional Expectations and Advancement in the 21st Century Schools
by Dragana Martinovic Yifat Ben-David Kolikant Marina Milner-BolotinThis book brings together researchers from Israel and Canada to discuss the challenges today's teachers and teacher‐educators face in their practice.There is a growing expectation that the 21st century STEM teachers re‐examine their teaching philosophies and adjust their practices to reflect the increasing role of digital technologies. This expectation presents a significant challenge to teachers, who are often asked to implement novel technology‐rich pedagogies they did not have a chance to experience as students or become comfortable with. To exacerbate this challenge, the 21st century teachers function not only in a frequently‐changing educational reality manifested by continuous reforms, but are also bombarded by often contradictory and competing demands from the legislators, administrators, parents, and students. How do we break the vicious circle of reforms and support STEM teachers in making a real change in student learning? This book is unique for at least three reasons. First, it showcases research situated in Israel and Canada that examines the challenges today's teachers and teacher‐educators face in their practice. While the governments of both countries emphasize STEM education, their approaches are different and thus provide for interesting comparisons. Second, in addition to including research-based chapters, prominent scholars discuss the contributions in each of the book sections, problematizing the issues from a global perspective. Third, technology has a potential to empower teachers in this era of change, and this book provides the unique insights from each country, while allowing for comparisons, discussing solutions, and asking new questions.This book will be of interest to all involved in STEM teacher education programs or graduate programs in education, as well as to educational administrators interested in implementing technology in their schools.
Stencyl Essentials
by Richard SneydIf you are a computer game enthusiast who has always wanted to know what it takes to build a playable game, or maybe you would like to expand your programming knowledge so that you can develop great computer games using a solid game engine and toolkit, then this book is for you.
A Step by Step Approach to the Modeling of Chemical Engineering Processes
by Liliane Maria Ferrareso LonaThis book treats modeling and simulation in a simple way, that builds on the existing knowledge and intuition of students. They will learn how to build a model and solve it using Excel.Most chemical engineering students feel a shiver down the spine when they see a set of complex mathematical equations generated from the modeling of a chemical engineering system. This is because they usually do not understand how to achieve this mathematical model, or they do not know how to solve the equations system without spending a lot of time and effort.Trying to understand how to generate a set of mathematical equations to represent a physical system (to model) and solve these equations (to simulate) is not a simple task. A model, most of the time, takes into account all phenomena studied during a Chemical Engineering course. In the same way, there is a multitude of numerical methods that can be used to solve the same set of equations generated from the modeling, and many different computational languages can be adopted to implement the numerical methods. As a consequence of this comprehensiveness and combinatorial explosion of possibilities, most books that deal with this subject are very extensive and embracing, making need for a lot of time and effort to go through this subject. It is expected that with this book the chemical engineering student and the future chemical engineer feel motivated to solve different practical problems involving chemical processes, knowing they can do that in an easy and fast way, with no need of expensive software.
Step-by-Step Wedding Photography
by Damon TucciPhotographing a wedding is one of the most demanding tasks a photographer can undertake. Because of the tremendous import of the event to the couple, their families, and their guests and attendants, there is no room for error. It's the photographer's job to get the images the couple expects and to capture those images in a stylish, highly artistic and professional manner as every important minute passes.With countless weddings under his belt, super-shooter Damon Tucci knows what it takes to get the job done. In this book, he presents 60 lessons that show you just what's expected and precisely how to make it all happen so that you can rest knowing that your couple's big day will be elegantly and flawlessly chronicled, from start to finish. Beginning with a look into the strategies you'll need to implement to ensure all of your bases are covered, Tucci gets you up to speed with initial lessons on ensuring the clients are a good fit, conducting an effective and efficient client consultation, and determining the must-have shots. Next, he moves on to cover the equipment needed for the wedding, the need for backups, and tips for paring down to the essentials.Targeted lessons will also show you how to anticipate the big events in the preparations, ceremony, and reception, so you can get all of the money shots that EVERY client demands. You'll also find plenty of lighting and posing ideas for the bride, groom, attendants, and families, so you can make sure that everyone looks their very best as your chronicle this meaningful and momentous day. Lastly, Tucci takes an in-depth look at the postproduction phase of the job, showing you how to carry out simple tasks using a host of popular programs and plug-ins. With Tucci's help, you'll learn to create the kinds of portrait looks that today's clients demand.
Step into the Metaverse: How the Immersive Internet Will Unlock a Trillion-Dollar Social Economy
by Mark van RijmenamAn incisive glimpse into the future of the internet In Step into the Metaverse: How the Immersive Internet Will Unlock a Trillion-Dollar Social Economy, future tech strategist, entrepreneur, and thought leader Dr. Mark van Rijmenam delivers a startlingly insightful discussion about how the world as we know it will fundamentally change as the physical and the digital worlds merge into the metaverse, impacting the everyday experiences of people, companies, and societies. The author maps out the extraordinary opportunities and challenges facing business leaders, consumers, regulators, policymakers, and other metaverse stakeholders trying to navigate the future of the Internet. In the metaverse, you can be who you want to be, where you want to be, and companies and consumers are only restricted by their own creativity how they can benefit from the immersive internet. With engaging commentary on issues ranging from avatars, identity and digital fashion to non-fungible tokens (NFTs), blockchain and the economics of the metaverse, this book also offers: Discussions on the importance of an open and interoperable metaverse build on the web 3.0 paradigm if we want to reign in the control of Big Tech over our identity, data and lives. Explorations of the enormous—and largely untapped—potential for metaverse entertainment, including gaming, music, media, and sports and how brands can engage with their customers in novel ways and how digital twins will change how we work and innovate. Considerations related to the dangers of an always-on, immersive internet, including data breaches, avatar imposters, mental health issues, corporate and state surveillance, and the need for metaverse law. A fascinating read you won’t be able to put down, Step into the Metaverse belongs in the hands of executives, managers, and other business leaders who play a role in digital transformation or execution. It's also an invaluable resource for anyone interested in the future of technology, the internet, and social interaction.
Step into the World of Mathematics: Math Is Beautiful and Belongs to All of Us
by Samuli SiltanenModern life is increasingly relying on digital technology, which in turn runs on mathematics. However, this underlying math is hidden from us. That is mostly a good thing since we do not want to be solving equations and calculating fractions just to get things done in our everyday business. But the mathematical details do matter for anyone who wants to understand how stuff works, or wishes to create something new in the jungle of apps and algorithms. This book takes a look at the mathematical models behind weather forecasting, climate change prediction, artificial intelligence, medical imaging and computer graphics. The reader is expected to have only a curious mind; technical math skills are not needed for enjoying this text.
A Step Towards Society 5.0: Research, Innovations, and Developments in Cloud-Based Computing Technologies (Demystifying Technologies for Computational Excellence)
by Shahnawaz KhanThis book serves the need for developing an insight and understanding of the cutting-edge innovation in Cloud technology. It provides an understanding of cutting-edge innovations, paradigms, and security by using real-life applications, case studies, and examples. This book provides a holistic view of cloud technology theories, practices, and future applications with real-life examples. It comprehensively explains cloud technology, design principles, development trends, maintaining state-of-the-art cloud computing and software services. It describes how cloud technology can transform the operating contexts of business enterprises. It exemplifies the potential of cloud computing for next-generation computational excellence and the role it plays as a key driver for the 4th industrial revolution in Industrial Engineering and a key driver for manufacturing industries. Researchers, academicians, postgraduates, and industry specialists will find this book of interest.
Stepping into Virtual Reality
by Mario A. Gutiérrez A. Frédéric Vexo Daniel ThalmannVirtual reality techniques are increasingly becoming indispensable in many areas. This book looks at how to generate advanced virtual reality worlds. It covers principles, techniques, devices and mathematical foundations, beginning with basic definitions, and then moving on to the latest results from current research and exploring the social implications of these. Very practical in its approach, the book is fully illustrated in colour and contains numerous examples, exercises and case studies. This textbook will allow students and practitioners alike to gain a practical understanding of virtual reality concepts, devices and possible applications.
Stepping Through Cybersecurity Risk Management: A Systems Thinking Approach
by Jennifer L. BayukStepping Through Cybersecurity Risk Management Authoritative resource delivering the professional practice of cybersecurity from the perspective of enterprise governance and risk management. Stepping Through Cybersecurity Risk Management covers the professional practice of cybersecurity from the perspective of enterprise governance and risk management. It describes the state of the art in cybersecurity risk identification, classification, measurement, remediation, monitoring and reporting. It includes industry standard techniques for examining cybersecurity threat actors, cybersecurity attacks in the context of cybersecurity-related events, technology controls, cybersecurity measures and metrics, cybersecurity issue tracking and analysis, and risk and control assessments. The text provides precise definitions for information relevant to cybersecurity management decisions and recommendations for collecting and consolidating that information in the service of enterprise risk management. The objective is to enable the reader to recognize, understand, and apply risk-relevant information to the analysis, evaluation, and mitigation of cybersecurity risk. A well-rounded resource, the text describes both reports and studies that improve cybersecurity decision support. Composed of 10 chapters, the author provides learning objectives, exercises and quiz questions per chapter in an appendix, with quiz answers and exercise grading criteria available to professors. Written by a highly qualified professional with significant experience in the field, Stepping Through Cybersecurity Risk Management includes information on: Threat actors and networks, attack vectors, event sources, security operations, and CISO risk evaluation criteria with respect to this activity Control process, policy, standard, procedures, automation, and guidelines, along with risk and control self assessment and compliance with regulatory standards Cybersecurity measures and metrics, and corresponding key risk indicators The role of humans in security, including the “three lines of defense” approach, auditing, and overall human risk management Risk appetite, tolerance, and categories, and analysis of alternative security approaches via reports and studies Providing comprehensive coverage on the topic of cybersecurity through the unique lens of perspective of enterprise governance and risk management, Stepping Through Cybersecurity Risk Management is an essential resource for professionals engaged in compliance with diverse business risk appetites, as well as regulatory requirements such as FFIEC, HIIPAA, and GDPR, as well as a comprehensive primer for those new to the field. A complimentary forward by Professor Gene Spafford explains why “This book will be helpful to the newcomer as well as to the hierophants in the C-suite. The newcomer can read this to understand general principles and terms. The C-suite occupants can use the material as a guide to check that their understanding encompasses all it should.”
Stereo Scene Flow for 3D Motion Analysis
by Daniel Cremers Andreas WedelThis book presents methods for estimating optical flow and scene flow motion with high accuracy, focusing on the practical application of these methods in camera-based driver assistance systems. Clearly and logically structured, the book builds from basic themes to more advanced concepts, culminating in the development of a novel, accurate and robust optic flow method. Features: reviews the major advances in motion estimation and motion analysis, and the latest progress of dense optical flow algorithms; investigates the use of residual images for optical flow; examines methods for deriving motion from stereo image sequences; analyses the error characteristics for motion variables, and derives scene flow metrics for movement likelihood and velocity; introduces a framework for scene flow-based moving object detection and segmentation; includes Appendices on data terms and quadratic optimization, and scene flow implementation using Euler-Lagrange equations, in addition to a helpful Glossary.
Stereoscopic Image Quality Assessment (Advanced Topics in Science and Technology in China #60)
by Yong Ding Guangming SunThis book provides a comprehensive review of all aspects relating to visual quality assessment for stereoscopic images, including statistical mathematics, stereo vision and deep learning. It covers the fundamentals of stereoscopic image quality assessment (SIQA), the relevant engineering problems and research significance, and also offers an overview of the significant advances in visual quality assessment for stereoscopic images, discussing and analyzing the current state-of-the-art in SIQA algorithms, the latest challenges and research directions as well as novel models and paradigms. In addition, a large number of vivid figures and formulas help readers gain a deeper understanding of the foundation and new applications of objective stereoscopic image quality assessment technologies.Reviewing the latest advances, challenges and trends in stereoscopic image quality assessment, this book is a valuable resource for researchers, engineers and graduate students working in related fields, including imaging, displaying and image processing, especially those interested in SIQA research.
Steve Jobs: The Man Who Thought Different
by Karen BlumenthalThis is the story of Steve Jobs who changed our world. In this book, Karen Blumenthal takes us to the core of the complicated and legendary man while simultaneously exploring the evolution of computers.
Steve Jobs: 1955-2011
by Bloomberg BusinessweekOriginating from the bestselling special-edition tribute Bloomberg Businessweek Steve Jobs 1955-2011, here is Bloomberg Businessweek's biography of a boundary-breaking thinker and endlessly astute businessman. From his birth and adoption by the Jobs family to his days in the California counterculture making games for Atari; from the peak of the insurgency against Microsoft to his forced exile from Apple; from Woody and Buzz to iTunes and the iPad, it's all here, a signature American life as told by our staff of writers and reporters, and the people who knew Jobs best. Here are first person accounts from business leaders who knew and worked with him, from Marc Andreessen to John Sculley. Pieces are written by Steve Jurvetson, John Sculley, Sean Wilsey and William Gibson, as well as Bloomberg News and Bloomberg Businessweek reporters and editors Jim Aley, Brad Stone and Peter Burrows.Eric Schmidt sums up his feeling about Steve Jobs, "He had a level of perception about feelings and emotions that was far beyond anything I've met in my entire life. His legacy will last for many years, through people he's trained and people he's influenced. But what death means is you can't call-you can't call him. It's a loss. I'll miss talking to him." This insightful and fascinating biography includes an informative timeline, glossary, and over 60 photos, that give insight into his life and times.
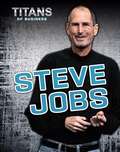
Steve Jobs: Technology Innovator and Apple Genius (Gateway Biographies Ser.)
by Matt DoedenOn October 5, 2011, the news of the death of technology innovator Steve Jobs rocked the world. The failing health of the Apple cofounder and Pixar CEO was no secret. Jobs had given up his role as Apple's CEO just a few months prior because of his struggle with pancreatic cancer. But his death still drew a huge reaction. From Apple employees and fans to political and business leaders, people honored Jobs's passing by reflecting on his prolific life that greatly influenced the way technology is used. In 1976, Jobs founded Apple Computer with Steve Wozniak. As the leaders of Apple, they developed concepts—such as navigating by using a mouse to click screen icons—that shaped the way we use and interact with computers. Jobs's forward-thinking engineering also influenced pop culture, bringing us a music revolution with the iPod, the ultimate communication device with the iPhone, and some of the first computer-animated films through Pixar. Called by some "the da Vinci of our time," Jobs used his innovation and vision to help advance technology like no other. He lived his life following a simple premise: "The only way to be truly satisfied is to do what you believe is great work. And the only way to do great work is to love what you do."
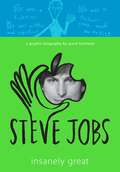
Steve Jobs: Insanely Great
by Jessie HartlandWhether they&’ve seen Aaron Sorkin and Danny Boyle&’s Steve Jobs movie, read Walter Isaacson&’s biography, or just own an iPhone, this graphic novel retelling of the Apple innovator&’s life will capture the imaginations of the legions of readers who live and breathe the technocentric world Jobs created. Told through a combination of black-and-white illustrations and handwritten text, this fast-paced and entertaining biography in graphic format presents the story of the ultimate American entrepreneur, the man who brought us Apple Computer, Pixar, Macs, iPods, iPhones, and more. Jobs&’s remarkable life reads like a history of the personal technology industry. He started Apple Computer in his parents&’ garage and eventually became the tastemaker of a generation, creating products we can&’t live without. Through it all, he was an overbearing and demanding perfectionist, both impossible and inspiring. Capturing his unparalleled brilliance, as well as his many demons, Jessie Hartland&’s engaging biography illuminates the meteoric successes, devastating setbacks, and myriad contradictions that make up the extraordinary life and legacy of the insanely great Steve Jobs.Here's the perfect book for any teen interested in STEM topics, especially tech. A School Library Journal Best Book of the Year &“If a picture is worth a thousand words, then this comic tale can hang with the sprawling biographies.&” —Macworld.com &“An accessible take . . . undoubtedly valuable for kids who are growing up using Apple&’s products but knowing little about the man who created them.&” —GeekDad.com
Steve Jobs
by Nick HunterHow has Apple Inc. come to dominate the technology industry? This book looks at the life of Steve Jobs, with a focus on how he became successful.
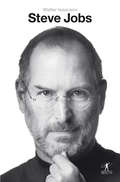
Steve Jobs
by Walter IsaacsonConheça a história do homem que pôs o futuro nas palmas das suas mãos.A biografia autorizada de Steve Jobs, a única escrita em colaboração com o próprio.A única biografia autorizada de Steve Jobs baseia-se em dezenas de entrevistas ao líder da Apple, aos seus familiares, amigos, colegas e até adversários. O resultado é uma história de vida fascinante e intensa, marcada pela personalidade invulgar de um empreendedor criativo, determinado e perfeccionista.Steve Jobs colaborou activamente no processo de criação desta biografia, partilhando experiências até agora nunca reveladas, com uma transparência e sinceridade inesperadas. Porque não temia a verdade, Jobs não impôs quaisquer limites ao biógrafo e aceitou falar de tudo. Igualmente reveladoras são as impressões dos seus amigos, companheiros e colegas, que contribuem para formar a imagem de um homem apaixonado, complexo e genial, nos negócios e na vida. Apoiado no inconformismo e numa vontade férrea, Steve Jobs revolucionou a indústria dos computadores, dos filmes de animação, da música e dos telefones. Transformou o modo como nos relacionamos com a tecnologia e deixou ao mundo um importantíssimo legado de inovação e criatividade.As suas criações reflectem a sua personalidade, tão carismática quanto problemática. A sua história de vida, marcada por altos e baixos, conquistas e obstáculos, é extremamente inspiradora, recheada de lições de inovação, liderança, carácter e valores.
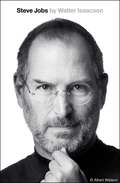
Steve Jobs (Litterature & Documents Ser.)
by Walter IsaacsonFROM THE AUTHOR OF THE BESTSELLING BIOGRAPHIES OF BENJAMIN FRANKLIN AND ALBERT EINSTEIN, THIS IS THE EXCLUSIVE BIOGRAPHY OF STEVE JOBS. Based on more than forty interviews with Jobs conducted over two years--as well as interviews with more than a hundred family members, friends, adversaries, competitors, and colleagues--Walter Isaacson has written a riveting story of the roller-coaster life and searingly intense personality of a creative entrepreneur whose passion for perfection and ferocious drive revolutionized six industries: personal computers, animated movies, music, phones, tablet computing, and digital publishing. At a time when America is seeking ways to sustain its innovative edge, and when societies around the world are trying to build digital-age economies, Jobs stands as the ultimate icon of inventiveness and applied imagination. He knew that the best way to create value in the twenty-first century was to connect creativity with technology. He built a company where leaps of the imagination were combined with remarkable feats of engineering. Although Jobs cooperated with this book, he asked for no control over what was written nor even the right to read it before it was published. He put nothing off-limits. He encouraged the people he knew to speak honestly. And Jobs speaks candidly, sometimes brutally so, about the people he worked with and competed against. His friends, foes, and colleagues provide an unvarnished view of the passions, perfectionism, obsessions, artistry, devilry, and compulsion for control that shaped his approach to business and the innovative products that resulted. Driven by demons, Jobs could drive those around him to fury and despair. But his personality and products were interrelated, just as Apple's hardware and software tended to be, as if part of an integrated system. His tale is instructive and cautionary, filled with lessons about innovation, character, leadership, and values.