- Table View
- List View
Statistical Power Analysis with Missing Data: A Structural Equation Modeling Approach
by Adam Davey Jyoti "Tina" SavlaStatistical power analysis has revolutionized the ways in which we conduct and evaluate research. Similar developments in the statistical analysis of incomplete (missing) data are gaining more widespread applications. This volume brings statistical power and incomplete data together under a common framework, in a way that is readily accessible to those with only an introductory familiarity with structural equation modeling. It answers many practical questions such as: How missing data affects the statistical power in a study How much power is likely with different amounts and types of missing data How to increase the power of a design in the presence of missing data, and How to identify the most powerful design in the presence of missing data. Points of Reflection encourage readers to stop and test their understanding of the material. Try Me sections test one’s ability to apply the material. Troubleshooting Tips help to prevent commonly encountered problems. Exercises reinforce content and Additional Readings provide sources for delving more deeply into selected topics. Numerous examples demonstrate the book’s application to a variety of disciplines. Each issue is accompanied by its potential strengths and shortcomings and examples using a variety of software packages (SAS, SPSS, Stata, LISREL, AMOS, and MPlus). Syntax is provided using a single software program to promote continuity but in each case, parallel syntax using the other packages is presented in appendixes. Routines, data sets, syntax files, and links to student versions of software packages are found at www.psypress.com/davey. The worked examples in Part 2 also provide results from a wider set of estimated models. These tables, and accompanying syntax, can be used to estimate statistical power or required sample size for similar problems under a wide range of conditions. Class-tested at Temple, Virginia Tech, and Miami University of Ohio, this brief text is an ideal supplement for graduate courses in applied statistics, statistics II, intermediate or advanced statistics, experimental design, structural equation modeling, power analysis, and research methods taught in departments of psychology, human development, education, sociology, nursing, social work, gerontology and other social and health sciences. The book’s applied approach will also appeal to researchers in these areas. Sections covering Fundamentals, Applications, and Extensions are designed to take readers from first steps to mastery.
Statistical Power Analysis: A Simple and General Model for Traditional and Modern Hypothesis Tests, Fourth Edition
by Kevin R. Murphy Brett Myors Allen WolachNoted for its accessible approach, this text applies the latest approaches of power analysis to both null hypothesis and minimum-effect testing using the same basic unified model. Through the use of a few simple procedures and examples, the authors show readers with little expertise in statistical analysis how to obtain the values needed to carry out the power analysis for their research. Illustrations of how these analyses work and how they can be used to choose the appropriate criterion for defining statistically significant outcomes are sprinkled throughout. The book presents a simple and general model for statistical power analysis based on the F statistic and reviews how to determine: the sample size needed to achieve desired levels of power; the level of power needed in a study; the size of effect that can be reliably detected by a study; and sensible criteria for statistical significance. The book helps readers design studies, diagnose existing studies, and understand why hypothesis tests come out out the way they do. The fourth edition features: -New Boxed Material sections provide examples of power analysis in action and discuss unique issues that arise as a result of applying power analyses in different designs. -Many more worked examples help readers apply the concepts presented. -Expanded coverage of power analysis for multifactor analysis of variance (ANOVA) to show readers how to analyze up to four factors with repeated measures on any or all of the factors. -Re-designed and expanded web based One Stop F Calculator software and data sets that allow users to perform all of the book's analyses and conduct significance tests, power analyses, and assessments of N and alpha needed for traditional and minimum-effects tests. -Easy to apply formulas for approximating the number of subjects required to reach adequate levels of power in a wide range of studies. Intended as a supplement for graduate/advanced undergraduate courses in research methods or experimental design, intermediate, advanced, or multivariate statistics, statistics II, or psychometrics, taught in psychology, education, business, and other social and health sciences, researchers also appreciate the book‘s applied approach.
Statistical Techniques in Geographical Analysis
by Gareth Shaw Stewart Barr Dennis WheelerThis volume includes changes in the switch from DOS-based to Windows-based, menu-driven forms of SPSS and MINITAB is the most important. The other change shows availability of data in digital form from websites or via CD-ROMs. The book is useful for teachers and students.
Statistical Tools for Program Evaluation: Methods and Applications to Economic Policy, Public Health, and Education
by Jean-Michel Josselin Benoît Le MauxThis book provides a self-contained presentation of the statistical tools required for evaluating public programs, as advocated by many governments, the World Bank, the European Union, and the Organization for Economic Cooperation and Development. After introducing the methodological framework of program evaluation, the first chapters are devoted to the collection, elementary description and multivariate analysis of data as well as the estimation of welfare changes. The book then successively presents the tools of ex-ante methods (financial analysis, budget planning, cost-benefit, cost-effectiveness and multi-criteria evaluation) and ex-post methods (benchmarking, experimental and quasi-experimental evaluation). The step-by-step approach and the systematic use of numerical illustrations equip readers to handle the statistics of program evaluation. It not only offers practitioners from public administrations, consultancy firms and nongovernmental organizations the basic tools and advanced techniques used in program assessment, it is also suitable for executive management training, upper undergraduate and graduate courses, as well as for self-study.
Statistics (Fourth Edition)
by David Friedman Robert Pisani Roger PurvesWe are going to tell you about some interesting problems which have been studied with the help of statistical methods, and show you how to use these methods yourself. We will try to explain why the methods work, and what to watch out for when others use them. Mathematical notation only seems to confuse things for many people, so this book relies on words, charts, and tables; there are hardly any x's or y's. As a matter of fact, even when professional mathematicians read technical books, their eyes tend to skip over the equations. What they really want is a sympathetic friend who will explain the ideas and draw the pictures behind the equations. We will try to be that friend, for those who read our book.
Statistics All-in-One For Dummies
by Deborah J. RumseyThe odds-on best way to master stats. Statistics All-in-One For Dummies is packed with lessons, examples, and practice problems to help you slay your stats course. Develop confidence and understanding in statistics with easy-to-understand (even fun) explanations of key concepts. Plus, you’ll get access to online chapter quizzes and other resources that will turn you into a stats master. This book teaches you how to interpret graphs, determine probability, critique data, and so much more. Written by an expert author and serious statistics nerd, Statistics AIO For Dummies explains everything in terms anyone can understand. Get a grasp of basic statistics concepts required in every statistics course Clear up the process of interpreting graphs, understanding polls, and analyzing data Master correlation, regression, and other data analysis tools Score higher on stats tests and get a better grade in your high school or college classStatistics All-in-One For Dummies follows the curriculum of intro college statistics courses (including AP Stats!) so you can learn everything you need to know to get the grade you need—the Dummies way.
Statistics Hacks: Tips & Tools for Measuring the World and Beating the Odds
by Bruce FreyWant to calculate the probability that an event will happen? Be able to spot fake data? Prove beyond doubt whether one thing causes another? Or learn to be a better gambler? You can do that and much more with 75 practical and fun hacks packed into Statistics Hacks. These cool tips, tricks, and mind-boggling solutions from the world of statistics, measurement, and research methods will not only amaze and entertain you, but will give you an advantage in several real-world situations-including business.This book is ideal for anyone who likes puzzles, brainteasers, games, gambling, magic tricks, and those who want to apply math and science to everyday circumstances. Several hacks in the first chapter alone-such as the "central limit theorem,", which allows you to know everything by knowing just a little-serve as sound approaches for marketing and other business objectives. Using the tools of inferential statistics, you can understand the way probability works, discover relationships, predict events with uncanny accuracy, and even make a little money with a well-placed wager here and there.Statistics Hacks presents useful techniques from statistics, educational and psychological measurement, and experimental research to help you solve a variety of problems in business, games, and life. You'll learn how to:Play smart when you play Texas Hold 'Em, blackjack, roulette, dice games, or even the lotteryDesign your own winnable bar bets to make money and amaze your friendsPredict the outcomes of baseball games, know when to "go for two" in football, and anticipate the winners of other sporting events with surprising accuracyDemystify amazing coincidences and distinguish the truly random from the only seemingly random--even keep your iPod's "random" shuffle honestSpot fraudulent data, detect plagiarism, and break codesHow to isolate the effects of observation on the thing observedWhether you're a statistics enthusiast who does calculations in your sleep or a civilian who is entertained by clever solutions to interesting problems, Statistics Hacks has tools to give you an edge over the world's slim odds.
Statistics II For Dummies
by Deborah J. RumseyContinue your statistics journey with this all-encompassing reference Completed Statistics through standard deviations, confidence intervals, and hypothesis testing? Then you’re ready for the next step: Statistics II. And there’s no better way to tackle this challenging subject than with Statistics II For Dummies! Get a brief overview of Statistics I in case you need to brush up on earlier topics, and then dive into a full explanation of all Statistic II concepts, including multiple regression, analysis of variance (ANOVA), Chi-square tests, nonparametric procedures, and analyzing large data sets. By the end of the book, you’ll know how to use all the statistics tools together to create a great story about your data. For each Statistics II technique in the book, you get an overview of when and why it’s used, how to know when you need it, step-by-step directions on how to do it, and tips and tricks for working through the solution. You also find: What makes each technique distinct and what the results say How to apply techniques in real life An interpretation of the computer output for data analysis purposes Instructions for using Minitab to work through many of the calculations Practice with a lot of examples With Statistics II For Dummies, you will find even more techniques to analyze a set of data. Get a head start on your Statistics II class, or use this in conjunction with your textbook to help you thrive in statistics!
Statistics Made Simple For School Leaders: Data-Driven Decision Making
by David J. Carroll Susan Rovezzi CarrollThe chief executive officer of a corporation is not much different from a public school administrator. While CEOs base many of their decisions on data, for school administrators, this type of research may conjure up miserable memories of searching for information to meet a graduate school requirement. However, the value of data-based decision making will continue to escalate and the school community--students, teachers, parents and the general public--expect this information to come from their administrators. Administrators are called on to be accountable, but few are capable of presenting the mountain of data that they collect in a cohesive and strategic manner. Most statistical books are focused on statistical theory versus application, but Statistics Made Simple for School Leaders presents statistics in a simple, practical, conceptual, and immediately applicable manner. It enables administrators to take their data and manage it into strategic information so the results can be used for action plans that benefit the school system. The approach is "user friendly" and leaves the reader with a confident can-do attitude to communicate results and plans to staff and the community.
Statistics class 11 - Tamil Nadu Board
by Government Of Tamil NaduAfter completion of Higher Secondary Course, the subject Statistics is an essential part of the curriculum of many undergraduate, postgraduate, professional courses and research level studies. At least one or more papers are included in the Syllabus of the following courses: Under Graduate Courses are: B.A.(Economics), B.Com, B.B.A, B.C.A, B.Sc. (Maths), B.Pharm, B.Ed, B.Stat, B.E, and Diploma Courses: Post Graduate Courses are M.A. (Economics), M.Com, M.B.A, M.C.A, M.Sc, M.Pharm, M.Ed, M.Stat, M.E, C.A, I.C.W.A, Actuarial science, Competitive Examinations like UPSC, TNPSC, Staff Selection Commission Examinations and I.A.S I.F.S and many more
Statistics class 12 - Tamil Nadu Board
by Training State Council of Educational ResearchKey Factors about the book: Learning objectives are brief statements that describe what students will be expected to learn by the end of school year, course, unit, lesson or class period. Additional information about the concept. Amazing facts, Rhetorical questions to lead students to statistic inquiry. Assess students' critical thinking and their understanding. To enhance digital skills among students.
Statistics for Clinicians: How Much Should a Doctor Know?
by Ahmed HassounaHow much statistics does a clinician, surgeon or nurse need to know?This book provides an essential handbook to help appraise evidence in a scientific paper, to design and interpret the results of research correctly, to guide our students and to review the work of our colleagues. This title is written by a clinician exclusively for fellow clinicians, in their own language and not in statistical or epidemiological terms.When clinicians discuss probability, it is focussed on how it applies to the management of patients in the flesh and how they are managed in a clinical setting. Statistics for Clinicians does not overlook the basis of statistics, but reviews techniques specific to medicine with an emphasis on their application. It ensures that readers have the correct tools to hand, including worked examples, guides and links to online calculators and free software, enabling readers to execute most statistical calculations. This book will therefore be enormously helpful for many working across all fields of medicine at any stage of their career.
Statistics for Empowerment and Social Engagement: Teaching Civic Statistics to Develop Informed Citizens
by Jim Ridgway“This book is a remarkable achievement” Gerd GigerenzerThis book offers practical approaches to working in a new field of knowledge - Civic Statistics - which sets out to engage with, and overcome well documented and long-standing problems in teaching quantitative skills. The book includes 23 peer-reviewed chapters, written in coordination by an international group of experts from ten countries. The book aims to support and enhance the work of teachers and lecturers working both at the high school and tertiary (university) levels. It is designed to promote and improve the critical understanding of quantitative evidence relevant to burning social issues – such as epidemics, climate change, poverty, migration, natural disasters, inequality, employment, and racism.Effective citizen engagement with social issues requires active participation and a broad understanding of data and statistics about societal issues. However, many statistics curricula are not designed to teach relevant skills nor to improve learners' statistical literacy. Evidence about social issues is provided to the public via print and digital media, official statistics offices, and other information channels, and a great deal of data is accessible both as aggregated summaries and as individual records. Chapters illustrate the approaches needed to teach and promote the knowledge, skills, dispositions, and enabling processes associated with critical understanding of Civic Statistics presented in many forms. These include: statistical analysis of authentic multivariate data; use of dynamic data visualisations; deconstructing texts about the social and economic well-being of societies and communities. Chapters discuss: the development of curricula and educational resources; use of emerging technologies and visualizations; preparation of teachers and teaching approaches; sources for relevant datasets and rich texts about Civic Statistics; ideas regarding future research, assessment, collaborations between different stakeholders; and other systemic issues.
Statistics for Exercise Science and Health with Microsoft Office Excel
by J. P. VermaThis book introduces the use of statistics to solve a variety of problems in exercise science and health and provides readers with a solid foundation for future research and data analysis. Statistics for Exercise Science and Health with Microsoft Office Excel: Aids readers in analyzing their own data using the presented statistical techniques combined with Excel Features comprehensive coverage of hypothesis testing and regression models to facilitate modeling in sports science Utilizes Excel to enhance reader competency in data analysis and experimental designs Includes coverage of both binomial and poison distributions with applications in exercise science and health Provides solved examples and plentiful practice exercises throughout in addition to case studies to illustrate the discussed analytical techniques Contains all needed definitions and formulas to aid readers in understanding different statistical concepts and developing the needed skills to solve research problems
Statistics for K-8 Educators
by Robert RosenfeldThis book offers an introduction to descriptive and inferential statistics tailored to the teaching and research needs of K-8 educators. Using statistics to tell a story, veteran teacher educator Robert Rosenfeld pushes readers away from simply performing a calculation to truly understanding the statistical concepts themselves. In addition to helping educators develop this statistical habit of mind, Rosenfeld also focuses on developing an understanding of the statistics in published research and on interpreting school data, which can be applied in school assessment and educational research. Features of this must-read resource include: Numerous exercises and activities throughout that are related specifically to the world of educators and are designed to foster conversation and small group discussion. Connections drawn between statistics and the regular mathematics curriculum to aid teachers who do classroom-based action research. A section covering the basic concepts of standardized tests, such as summative versus formative assessment, and standards-based versus norm-referenced tests. Accessibly written and conversational in tone, Statistics for K-8 Eductors provides the technical foundation to help teachers make good sense of quantitative information connected to their classrooms and to their schools.
Statistics for Kids: Model Eliciting Activities to Investigate Concepts in Statistics (Grades 4-6)
by Scott ChamberlinPerhaps the most useful and neglected content area of mathematics is statistics, especially for students in Grades 4-6. Couple that fact with the notion that mathematical modeling is an increasing emphasis in many standards, such as the Common Core State Standards for Mathematics and the NCTM standards, and the necessity for this topic is overdue. In this book, teachers will facilitate learning using model-eliciting activities (MEAs), problem-solving tasks created by mathematics educators to encourage students to investigate concepts in mathematics through the creation of mathematical models. Students will explore statistical concepts including trends, spread of data, standard deviation, variability, correlation, sampling, and more—all of which are designed around topics of interest to students. Grades 4-6
Statistics for Linguists: An Introduction Using R
by Bodo WinterStatistics for Linguists: An Introduction Using R is the first statistics textbook on linear models for linguistics. The book covers simple uses of linear models through generalized models to more advanced approaches, maintaining its focus on conceptual issues and avoiding excessive mathematical details. It contains many applied examples using the R statistical programming environment. Written in an accessible tone and style, this text is the ideal main resource for graduate and advanced undergraduate students of Linguistics statistics courses as well as those in other fields, including Psychology, Cognitive Science, and Data Science.
Statistics for Psychology Research: A Short Guide Using Excel
by Adam T. Hutcheson Kristina Groce BrownThis book aims to help psychology students build their skills to conduct research and analyses using Microsoft Excel’s Data Analysis Toolpak. Concise yet comprehensive, this accessible textbook walks students through basic research methodology, central tendency, variability, standardized scores, t-tests (independent and related samples), One-way Analysis of Variance (between-groups and repeated measures), the Pearson correlation, and Chi Square analyses. Each chapter includes examples of research questions to be addressed, the rationale for the analysis, a step-by-step analysis of the dataset in equation format and using Microsoft Excel, and how to present results in APA (7th Edition) style. The extensive didactic material encompasses end-of-chapter questions, learning outcomes, sidebar boxes with common mistakes to avoid, and biographical sketches of those who developed research methods and statistical techniques. Students and instructors will also benefit from a companion website where PowerPoint slides and additional exercises, datasets, and resources are available. Ideal for undergraduate psychology courses, this textbook can also be of use for those interested in learning more about statistical research and its practical application at university and beyond. Test your knowledge with questions and answers about the book with Springer Nature Flashcards.
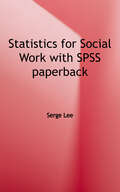
Statistics for Social Work With SPSS
by Serge LeeThis book provides readers with a user-friendly, evidence-based, and practical resource to help them make sense of, organize, analyze, and interpret data in contemporary contexts. It incorporates one of the most well-known statistics software applications, the Statistical Package for the Social Science (SPSS), within each chapter to help readers integrate their knowledge either manually or with the assistance of technology. The book begins with a brief introduction to statistics and research, followed by chapters that address variables, frequency distributions, measures of central tendency, and measures of variability. Additional chapters cover probability and hypothesis testing; normal distribution and Z score; correlation; simple linear regression; one-way ANOVA; and more. Each chapter features concise, simple explanations of key terms, formulas, and calculations; study questions and answers; specific SPSS instructions on computerized computations; and evidence-based, practical examples to support the learning experience. Presenting students with highly accessible and universally understandable statistical concepts, this is an ideal textbook for undergraduate and graduate-level courses in social work statistics, as well as research-based courses within the social and behavioral sciences.
Statistics for the Behavioral Sciences
by Frederick J. Gravetter Larry B. WallnauMaster statistics with STATISTICS FOR THE BEHAVIORAL SCIENCES! With straightforward instruction, built-in learning aids, and real world examples, this psychology text provides you with the tools you need to succeed. You will have numerous opportunities to practice statistical techniques through learning checks, examples, demonstrations, and problems. Exam preparation is made easy with a student companion website that provides tutorials, crossword puzzles, flashcards, learning objectives, and more!
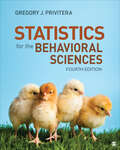
Statistics for the Behavioral Sciences
by Gregory J. PriviteraRecipient of the 2024 Textbook & Academic Authors Association (TAA) Textbook Excellence Award This award recognizes excellence in current textbooks and learning materials. Statistics for the Behavioral Sciences by award-winning author Gregory Privitera aims to not only inspire students to use statistics properly to better understand the world around them, but also to develop the skills to be lab-ready in applied research settings. Incorporating examples from current, relatable research throughout the text, Privitera shows students that statistics can be relevant, interesting, and accessible. Robust pedagogy encourages students to continually check their comprehension and hone their skills by working through problem sets throughout the text, including exercises that seamlessly integrate SPSS. This new Fourth Edition gives students a greater awareness of the best practices of analysis in the behavioral sciences, with a focus on transparency in recording, managing, analyzing, and interpreting data. Included with this title: LMS Cartridge: Import this title′s instructor resources into your school′s learning management system (LMS) and save time. Don′t use an LMS? You can still access all of the same online resources for this title via the password-protected Instructor Resource Site.
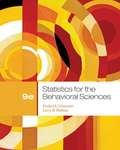
Statistics for the Behavioral Sciences (9th Edition)
by Larry B. Wallnau Frederick J GravetterThe author illustrates the importance of statistics in the study of behavioral science and how it provides researchers with objective and systematic methods for describing and interpreting their research results.
Statistics in Early Childhood and Primary Education: Supporting Early Statistical and Probabilistic Thinking (Early Mathematics Learning and Development)
by Aisling Leavy Maria Meletiou-Mavrotheris Efi PaparistodemouThis compilation focuses on the theory and conceptualisation of statistics and probability in the early years and the development of young children’s (ages 3-10) understanding of data and chance. It provides a comprehensive overview of cutting-edge international research on the development of young learners’ reasoning about data and chance in formal, informal, and non-formal educational contexts. The authors share insights into young children’s statistical and probabilistic reasoning and provide early childhood educators and researchers with a wealth of illustrative examples, suggestions, and practical strategies on how to address the challenges arising from the introduction of statistical and probabilistic concepts in pre-school and school curricula. This collection will inform practices in research and teaching by providing a detailed account of current best practices, challenges, and issues, and of future trends and directions in early statistical and probabilistic learning worldwide. Further, it will contribute to future research and theory building by addressing theoretical, epistemological, and methodological considerations regarding the design of probability and statistics learning environments for young children.
Statistics in Plain English
by Timothy C. UrdanStatistics in Plain English is a straightforward, conversational introduction to statistics that delivers exactly what its title promises. Each chapter begins with a brief overview of a statistic (or set of statistics) that describes what the statistic does and when to use it, followed by a detailed step-by-step explanation of how the statistic works and exactly what information it provides. Chapters also include an example of the statistic (or statistics) used in real-world research, "Worked Examples," "Writing It Up" sections that demonstrate how to write about each statistic, "Wrapping Up and Looking Forward" sections, and practice work problems. Thoroughly updated throughout, this edition features several key additions and changes. First, a new chapter on person-centered analyses, including cluster analysis and latent class analysis (LCA) has been added, providing an important alternative to the more commonly used variable-centered analyses (e.g., t tests, ANOVA, regression). Next, the chapter on non-parametric statistics has been enhanced with in-depth descriptions of Mann-Whitney U, Kruskal-Wallis, and Wilcoxon Signed-Rank analyses, in addition to the detailed discussion of the Chi-square statistic found in the previous edition. These nonparametric statistics are widely used when dealing with nonnormally distributed data. This edition also includes more information about the assumptions of various statistics, including a detailed explanation of the assumptions and consequences of violating the assumptions of regression, as well as more coverage of the normal distribution in statistics. Finally, the book features a multitude of real-world examples throughout to aid student understanding and provides them with a solid understanding of how several statistics techniques commonly used by researchers in the social sciences work. Statistics in Plain English is suitable for a wide range of readers, including students taking their first statistics course, professionals who want to refresh their statistical memory, and undergraduate or graduate students who need a concise companion to a more complicated text used in their class. The text works as a standalone or as a supplement and covers a range of statistical concepts from descriptive statistics to factor analysis and person-centered analyses.
