- Table View
- List View

Amazing Mathematicians - A Short eBook
by Charles MargerisonMathematics is the science of numbers. However, have you ever stopped to ask - who are the people behind the amazing formulas that have helped mankind find solutions to everyday probabilities? The Amazing People Club invites you to explore the exciting world of five amazing mathematicians. Their inspirational stories were not always about number crunching as we know it, as they strived in the search for 'truth' via theory. Gain an insight into how George Boole was inspired to combine logic with mathematics to reduce risks, developing calculations that although complex, enabled people to make better judgements. Immerse yourself in the life of Ada Lovelace, the "Enchantress of Numbers". Her intellect and skill in mathematics led to her developing a plan for calculating sequence, which is now recognized as the first computer program. Be inspired by the genius minds of Rene Descartes, Carl Gauss and Alan Turing, whose skills within mathematics, science and technology have formed the basis for how we still assess probabilities and find solutions to this very day. Each story comes to life through BioViews®. These are short biographical narratives, similar to interviews. They provide an easy way of learning about amazing people who made major contributions and changed our world.
Amazing Tales from the Boston Red Sox Dugout: A Collection of the Greatest Red Sox Stories Ever Told (Tales From The Team Ser.)
by Jim Prime Bill NowlinCalling all BoSox fans! In this one-of-a-kind compendium of anecdotes from players, managers, and beat writers, Jim Prime and Bill Nowlin capture all the magic and passion of Boston Red Sox baseball. Amazing Tales from the Boston Red Sox Dugout is a colorful journey through the history of the franchise. Included are the best memories and stories in the players’ and managers’ own words, as found in Prime and Nowlin’s Tales from the Boston Red Sox Dugout and More Tales from the Boston Red Sox Dugout.Within these pages, fans will chafe at the rivalries, cheer the wins, and challenge the losses both on the road and at home. From the earliest days of a promising young pitcher named Babe Ruth, through the glory years of Foxx, Williams, and Yastrzemiski, to the championship era of superstars such as Martinez and Ortiz, the Red Sox epitomize all that is grand about the grand old game. Featured players and managers include Wade Boggs, Joe Cronin, Bobby Doerr, Carlton Fisk, Dustin Pedrioa, Jim Rice, Jason Varitek, and many other Red Sox legends. This massive collection captures the story and glory of Red Sox baseball both on the field and off. Without a doubt, this tantalizing offering from Prime and Nowlin will provide hours of entertainment for Red Sox and baseball fans alike.
Amazing Tales from the Cleveland Indians Dugout: A Collection of the Greatest Tribe Stories Ever Told (Tales from the Team)
by Russell SchneiderCalling all Tribe fans! In this one-of-a-kind compendium of anecdotes from players, managers, and beat writers, Russell Schneider captures all the magic and passion of Cleveland Indians baseball. Amazing Tales from the Cleveland Indians Dugout is a colorful journey through the history of the franchise. Included are the best memories and stories in the players’ and managers’ own words, as found in Schneider’s Tales from the Tribe Dugout and More Tales from the Tribe Dugout.Within these pages, fans will chafe at the rivalries, cheer the wins, and challenge the losses both on the road and at home. Max Alvis reveals his most embarrassing moment on the field, Mickey Cochrane orders Harry Eisenstat to intentionally bean a batter, and Doc Edwards groans in agony during the game in which he finally figures out Cal Ripken’s signals to the outfield (the Indians scored ten runs by knowing which pitch was coming and still managed to lose). Featured players include the Alomar brothers, Lou Boudreau, Orel Hershiser, Ralph Kiner, Minnie Minoso, Omar Vizquel, and many other Tribe legends. This massive collection captures the story and glory of Indians baseball both on the field and off. Without a doubt, this tantalizing offering from Indians expert Russell Schneider will provide hours of entertainment for Indians and baseball fans alike.
Amazing and Aesthetic Aspects of Analysis (Undergraduate Texts In Mathematics Ser.)
by Paul LoyaLively prose and imaginative exercises draw the reader into this unique introductory real analysis textbook. Motivating the fundamental ideas and theorems that underpin real analysis with historical remarks and well-chosen quotes, the author shares his enthusiasm for the subject throughout. A student reading this book is invited not only to acquire proficiency in the fundamentals of analysis, but to develop an appreciation for abstraction and the language of its expression. In studying this book, students will encounter:the interconnections between set theory and mathematical statements and proofs;the fundamental axioms of the natural, integer, and real numbers;rigorous ε-N and ε-δ definitions;convergence and properties of an infinite series, product, or continued fraction;series, product, and continued fraction formulæ for the various elementary functions and constants.Instructors will appreciate this engaging perspective, showcasing the beauty of these fundamental results.
Ambient Assisted Living: ForItAAL 2023 (Lecture Notes in Bioengineering)
by Pietro Siciliano Andrea Monteriù Alice Bettelli Mario Bochicchio Domenico De FanoThis book provides state-of-the-art information on ambient assisted living (AAL), and focuses on technologies, services, living spaces, policies, and interventions to promote health, improve quality of life, and active aging. It includes various research contributions, case studies, and projects where assistive technologies are successfully applied in the field, and it covers a wide range of topics: Tailoring products and services to the Aging society, Bio-data and Artificial sensing AAL scenarios, Cognition, and Technologies, and Designing for Inclusion and Well-Being. The volume gathers the refereed proceedings of the 12th Italian Forum on Ambient Assisted Living (ForItAAL), held in Bari, Italy on June 14-16, 2023. With its wide-ranging contributions to the topic, the book will inspire the readers and the researchers to continue their exploration of AAL technologies to support the development of products and services that make a real difference in people’s daily lives.
Ambient Intelligence– Software and Applications – 8th International Symposium on Ambient Intelligence (Advances in Intelligent Systems and Computing #615)
by Paulo Novais Vicente Julián Juan F. De Paz Gabriel Villarrubia Goreti MarreirosAmbient Intelligence (AmI) is a recent paradigm emerging from Artificial Intelligence, in which computers are used as proactive tools to assist people with their day-to-day activities, making their lives more comfortable. Another main goal of AmI originates from the human/computer interaction domain and focuses on offering ways to interact with systems in a more natural way by means of user-friendly interfaces. This field is evolving quickly, as can be witnessed by the emerging natural-language-based and gesture-based types of interaction. The inclusion of computational power and communication technologies in everyday objects is growing, and their embeddedness in our environments should be as invisible as possible. In order for AmI to be successful, human interaction with computing power and embedded systems in the surroundings should be smooth and take place without people actually noticing it. The only things people should notice in connection with AmI are more safety, comfort and wellbeing, emerging in a natural and inherent way. ISAmI is the International Symposium on Ambient Intelligence and aims to bring together researchers from the various disciplines that constitute the scientific field of Ambient Intelligence to present and discuss the latest results, new ideas, projects and lessons learned, especially in terms of software and applications.
Ambit Stochastics (Probability Theory and Stochastic Modelling #88)
by Fred Espen Benth Ole E. Barndorff-Nielsen Almut E. VeraartDrawing on advanced probability theory, Ambit Stochastics is used to model stochastic processes which depend on both time and space. This monograph, the first on the subject, provides a reference for this burgeoning field, complete with the applications that have driven its development. Unique to Ambit Stochastics are ambit sets, which allow the delimitation of space-time to a zone of interest, and ambit fields, which are particularly well-adapted to modelling stochastic volatility or intermittency. These attributes lend themselves notably to applications in the statistical theory of turbulence and financial econometrics. In addition to the theory and applications of Ambit Stochastics, the book also contains new theory on the simulation of ambit fields and a comprehensive stochastic integration theory for Volterra processes in a non-semimartingale context. Written by pioneers in the subject, this book will appeal to researchers and graduate students interested in empirical stochastic modelling.
Ambit Stochastics (Probability Theory and Stochastic Modelling #88)
by Fred Espen Benth Almut E. Veraart Ole E. Barndorff-NielsenDrawing on advanced probability theory, Ambit Stochastics is used to model stochastic processes which depend on both time and space. This monograph, the first on the subject, provides a reference for this burgeoning field, complete with the applications that have driven its development. Unique to Ambit Stochastics are ambit sets, which allow the delimitation of space-time to a zone of interest, and ambit fields, which are particularly well-adapted to modelling stochastic volatility or intermittency. These attributes lend themselves notably to applications in the statistical theory of turbulence and financial econometrics. In addition to the theory and applications of Ambit Stochastics, the book also contains new theory on the simulation of ambit fields and a comprehensive stochastic integration theory for Volterra processes in a non-semimartingale context. Written by pioneers in the subject, this book will appeal to researchers and graduate students interested in empirical stochastic modelling.
Amenable Banach Algebras: A Panorama (Springer Monographs in Mathematics)
by Volker RundeThis volume provides readers with a detailed introduction to the amenability of Banach algebras and locally compact groups. By encompassing important foundational material, contemporary research, and recent advancements, this monograph offers a state-of-the-art reference. It will appeal to anyone interested in questions of amenability, including those familiar with the author’s previous volume Lectures on Amenability. Cornerstone topics are covered first: namely, the theory of amenability, its historical context, and key properties of amenable groups. This introduction leads to the amenability of Banach algebras, which is the main focus of the book. Dual Banach algebras are given an in-depth exploration, as are Banach spaces, Banach homological algebra, and more. By covering amenability’s many applications, the author offers a simultaneously expansive and detailed treatment. Additionally, there are numerous exercises and notes at the end of every chapter that further elaborate on the chapter’s contents. Because it covers both the basics and cutting edge research, Amenable Banach Algebras will be indispensable to both graduate students and researchers working in functional analysis, harmonic analysis, topological groups, and Banach algebras. Instructors seeking to design an advanced course around this subject will appreciate the student-friendly elements; a prerequisite of functional analysis, abstract harmonic analysis, and Banach algebra theory is assumed.
America Classifies the Immigrants: From Ellis Island to the 2020 Census
by Joel PerlmannWhen more than twenty million immigrants arrived in the United States between 1880 and 1920, the government attempted to classify them according to prevailing ideas about race and nationality. But this proved hard to do. Ideas about racial or national difference were slippery, contested, and yet consequential—were “Hebrews” a “race,” a “religion,” or a “people”? As Joel Perlmann shows, a self-appointed pair of officials created the government’s 1897 List of Races and Peoples, which shaped exclusionary immigration laws, the wording of the U.S. Census, and federal studies that informed social policy. Its categories served to maintain old divisions and establish new ones. <P><P> Across the five decades ending in the 1920s, American immigration policy built increasingly upon the belief that some groups of immigrants were desirable, others not. Perlmann traces how the debates over this policy institutionalized race distinctions—between whites and nonwhites, but also among whites—in immigration laws that lasted four decades. <P><P> Despite a gradual shift among social scientists from “race” to “ethnic group” after the 1920s, the diffusion of this key concept among government officials and the public remained limited until the end of the 1960s. Taking up dramatic changes to racial and ethnic classification since then, America Classifies the Immigrants concentrates on three crucial reforms to the American Census: the introduction of Hispanic origin and ancestry (1980), the recognition of mixed racial origins (2000), and a rethinking of the connections between race and ethnic group (proposed for 2020).
America by the Numbers: Quantification, Democracy, and the Birth of National Statistics (Infrastructures)
by Emmanuel DidierHow new techniques of quantification shaped the New Deal and American democracy.When the Great Depression struck, the US government lacked tools to assess the situation; there was no reliable way to gauge the unemployment rate, the number of unemployed, or how many families had abandoned their farms to become migrants. In America by the Numbers, Emmanuel Didier examines the development in the 1930s of one such tool: representative sampling. Didier describes and analyzes the work of New Deal agricultural economists and statisticians who traveled from farm to farm, in search of information that would be useful for planning by farmers and government agencies. Didier shows that their methods were not just simple enumeration; these new techniques of quantification shaped the New Deal and American democracy even as the New Deal shaped the evolution of statistical surveys.Didier explains how statisticians had to become detectives and anthropologists, searching for elements that would help them portray America as a whole. Representative surveys were one of the most effective instruments for their task. He examines pre-Depression survey techniques; the invention of the random sampling method and the development of the Master Sample; and the application of random sampling by employment experts to develop the “Trial Census of Unemployment.”
America in the Twenties: A History
by Geoffrey PerretEveryone knows the Twenties: flappers, jazz bands, the Charleston, teacups filled with bathtub gin-one long party and everyone had a hangover (known as the Depression) in the morning. The Twenties are both the most derided decade in American history and the most glamorous. It has been a pleasant experience to be told "How interesting" when people wanted to know what I was writing. They often elaborated with remarks such as "What a wonderfully decadent time!" or "That was the last time Americans really knew how to enjoy themselves." Almost without exception the hundred or more people who've asked me about this book had a firm, unshakable idea of what the period was like. I had begun with much the same idea myself. I thought of the Twenties as a period that had been "done"-to a turn.
American Jewish Year Book 2012: The Annual Record of the North American Jewish Communities (American Jewish Year Book #113)
by Ira Sheskin Arnold DashefskyThe 2012 American Jewish Year Book, "The Annual Record of American Jewish Civilization," contains major chapters on Jewish secularism (Barry Kosmin and Ariela Keysar), Canadian Jewry (Morton Weinfeld, David Koffman, and Randal Schnoor), national affairs (Ethan Felson), Jewish communal affairs (Lawrence Grossman), Jewish population in the United States (Ira Sheskin and Arnold Dashefsky), and World Jewish population (Sergio DellaPergola). These chapters provide insight into major trends in the North American and world Jewish community. The volume also acts as a resource for the American Jewish community and for academics studying that community by supplying obituaries and lists of Jewish Federations, Jewish Community Centers, national Jewish organizations, Jewish overnight camps, Jewish museums, Holocaust museums, local and national Jewish periodicals, Jewish honorees, major recent events in the American Jewish community, and academic journals, articles, websites, and books. The volume should prove useful to social scientists and historians of the American Jewish community, Jewish communal workers, the press, and others interested in American and Canadian Jews.
American-Style Derivatives: Valuation and Computation (Chapman and Hall/CRC Financial Mathematics Series)
by Jerome DetempleFocusing on recent developments in the field, American-Style Derivatives provides an extensive treatment of option pricing with emphasis on the valuation of American options on dividend-paying assets. This book reviews valuation principles for European contingent claims and extends the analysis to American contingent claims. It presents basic valuation principles for American options including barrier, capped, and multi-asset options. It also reviews numerical methods for option pricing and compares their relative performance. Ideal for students and researchers in quantitative finance, this material is accessible to those with a background in stochastic processes or derivative securities.
Americans Abroad: A Comparative Study of Emigrants from the United States
by Arnold Dashefsky Karen A. Woodrow-LafieldThis book takes a new look at the study of emigration since publication of Americans Abroad in 1992. The US receives a high volume of immigrants, but its emigrant population is less frequently studied. International migration continues to increase, with now over 200 million people worldwide living as emigrants from their birth country for the purposes of work, family integration, improved living situations, or human rights. Utilizing the same social psychological approach that made the first edition so successful, the authors examine the motivation, adjustment issues and return migration of American emigrants. The analysis of these comparative experiences reveals core elements of American culture. With a new introductory chapter, a Foreword, and two Postscripts on US emigrants in Australia and Israel, the second edition builds on the strengths of the first edition to provide an important resource for the current state of US emigration. New topics covered include: what groups are emigrating from the US and why; rising departures and emigration of unauthorized immigrants; perceptions of US population about living abroad; US laws, dual citizenship, taxation, and transnationalism; famous US emigrants; and trends/projections for the future.
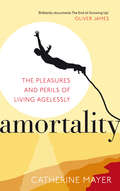
Amortality: The Pleasures and Perils of Living Agelessly
by Catherine MayerDoes your real age match the age you feel?When do we reach middle age?When, if ever, are we old?The way we age and the way we perceive age has changed radically. As we embrace new experiences, relationships and gadgets, we barely stop to look at our watches let alone consider whether our behaviour is 'age appropriate'.In this provocative and timely book, Catherine Mayer looks at the forces that created amortality - the term she coined to describe the phenomenon of living agelessly. As she follows this social epidemic through generations and across continents, she reveals its profound impact on society, our careers, our families and ourselves.Why be defined by numbers?Are you amortal?
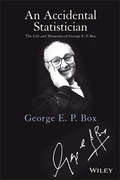
An Accidental Statistician
by George E. BoxCelebrating the life of an admired pioneer in statisticsIn this captivating and inspiring memoir, world-renowned statistician George E. P. Box offers a firsthand account of his life and statistical work. Writing in an engaging, charming style, Dr. Box reveals the unlikely events that led him to a career in statistics, beginning with his job as a chemist conducting experiments for the British army during World War II. At this turning point in his life and career, Dr. Box taught himself the statistical methods necessary to analyze his own findings when there were no statisticians available to check his work.Throughout his autobiography, Dr. Box expertly weaves a personal and professional narrative to illustrate the effects his work had on his life and vice-versa. Interwoven between his research with time series analysis, experimental design, and the quality movement, Dr. Box recounts coming to the United States, his family life, and stories of the people who mean the most to him.This fascinating account balances the influence of both personal and professional relationships to demonstrate the extraordinary life of one of the greatest and most influential statisticians of our time. An Accidental Statistician also features:* Two forewords written by Dr. Box's former colleagues and closest confidants* Personal insights from more than a dozen statisticians on how Dr. Box has influenced and continues to touch their careers and lives* Numerous, previously unpublished photos from the author's personal collectionAn Accidental Statistician is a compelling read for statisticians in education or industry, mathematicians, engineers, and anyone interested in the life story of an influential intellectual who altered the world of modern statistics.
An Adventure in Statistics: The Reality Enigma
by Andy FieldAPEX Award 2023 for Publication Excellence: Print Media - Education & Training Shortlisted for the British Psychological Society Book Award 2017 Shortlisted for the British Book Design and Production Awards 2016 Shortlisted for the Association of Learned & Professional Society Publishers Award for Innovation in Publishing 2016 Now in its second edition, An Adventure in Statistics: The Reality Enigma by best-selling author and award-winning teacher Andy Field offers a better way to learn statistics. It combines rock-solid statistics coverage with compelling visual storytelling to address the conceptual difficulties that students learning statistics for the first time often encounter in introductory courses. Students are guided away from rote memorization towards independent, critical thinking and problem solving. This essential foundation to understanding statistics is woven into the unique action-packed story of Zach, who thinks, processes information and faces challenges to his understanding in the same way as a statistics novice. Illustrated with stunning, graphic novel-style art and featuring Socratic dialogue, the story captivates readers as it introduces them to concepts, eliminating potential statistics anxiety. No previous statistics knowledge is presumed, and no use of data analysis software is required – everything you would expect for an introductory course is covered but with a contemporary twist, arming students with a strong grounding in understanding classical and Bayesian approaches to data analysis. With its unique combination of story, concepts and terminology, this complete introduction to statistics from bestselling author Andy Field breaks the mould to present a statistical tale like no other. Stay connected Join us on Facebook and share your experiences with Andy’s texts, check out news, access free stuff, see photos, watch videos, learn about competitions, and much more.
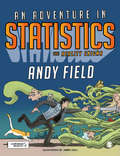
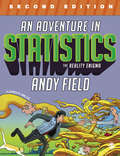
An Adventure in Statistics: The Reality Enigma
by Professor Andy FieldShortlisted for the British Psychological Society Book Award 2017 Shortlisted for the British Book Design and Production Awards 2016 Shortlisted for the Association of Learned & Professional Society Publishers Award for Innovation in Publishing 2016 An Adventure in Statistics: The Reality Enigma by best-selling author and award-winning teacher Andy Field offers a better way to learn statistics. It combines rock-solid statistics coverage with compelling visual story-telling to address the conceptual difficulties that students learning statistics for the first time often encounter in introductory courses - guiding students away from rote memorization and toward critical thinking and problem solving. Field masterfully weaves in a unique, action-packed story starring Zach, a character who thinks like a student, processing information, and the challenges of understanding it, in the same way a statistics novice would. Illustrated with stunning graphic novel-style art and featuring Socratic dialogue, the story captivates readers as it introduces them to concepts, eliminating potential statistics anxiety. The book assumes no previous statistics knowledge nor does it require the use of data analysis software. It covers the material you would expect for an introductory level statistics course that Field’s other books (Discovering Statistics Using IBM SPSS Statistics and Discovering Statistics Using R) only touch on, but with a contemporary twist, laying down strong foundations for understanding classical and Bayesian approaches to data analysis. In doing so, it provides an unrivalled launch pad to further study, research, and inquisitiveness about the real world, equipping students with the skills to succeed in their chosen degree and which they can go on to apply in the workplace. The Story and Main Characters The Reality Revolution In the City of Elpis, in the year 2100, there has been a reality revolution. Prior to the revolution, Elpis citizens were unable to see their flaws and limitations, believing themselves talented and special. This led to a self-absorbed society in which hard work and the collective good were undervalued and eroded. To combat this, Professor Milton Grey invented the reality prism, a hat that allowed its wearers to see themselves as they really were - flaws and all. Faced with the truth, Elpis citizens revolted and destroyed and banned all reality prisms. The Mysterious Disappearance Zach and Alice are born soon after all the prisms have been destroyed. Zach, a musician who doesn’t understand science, and Alice, a geneticist who is also a whiz at statistics, are in love. One night, after making a world-changing discovery, Alice suddenly disappears, leaving behind a song playing on a loop and a file with her research on it. Statistics to the Rescue! Sensing that she might be in danger, Zach follows the clues to find her, as he realizes that the key to discovering why Alice has vanished is in her research. Alas! He must learn statistics and apply what he learns in order to overcome a number of deadly challenges and find the love of his life. As Zach and his pocket watch, The Head, embark on their quest to find Alice, they meet Professor Milton Grey and Celia, battle zombies, cross a probability bridge, and encounter Jig:Saw, a mysterious corporation that might have something to do with Alice’s disappearance… Author News "Eight years ago I had the idea to write a fictional story through which the student learns statistics via a shared adventure with the main character..." Read the complete article from Andy Field on writing his new book Times Higher Education article: “Andy Field takes statistics adventure to a new level” Stay Connected Connect with us on Facebook and share your experiences with Andy’s texts, check out news, access free stuff, see photos, watch videos, learn about competitions, and much more. Video Links Go behind the scenes and learn more about the man behind the book: Watch Andy talk about why he created a statistics book using the framework of a novel and illustratio
An Adventurer's Guide to Number Theory (Dover Books On Mathematics Ser.)
by Richard FriedbergIn this delightful guide, a noted mathematician and teacher offers a witty, historically oriented introduction to number theory, dealing with properties of numbers and with numbers as abstract concepts. Written for readers with an understanding of arithmetic and beginning algebra, the book presents the classical discoveries of number theory, including the work of Pythagoras, Euclid, Diophantus, Fermat, Euler, Lagrange and Gauss.Unlike many authors, however, Mr. Friedberg encourages students to think about the imaginative, playful qualities of numbers as they consider such subjects as primes and divisibility, quadratic forms and residue arithmetic and quadratic reciprocity and related theorems. Moreover, the author has included a number of unusual features to challenge and stimulate students: some of the original problems in Diophantus' Arithmetica, proofs of Fermat's Last Theorem for the exponents 3and 4, and two proofs of Wilson's Theorem.Readers with a mathematical bent will enjoy and benefit from these entertaining and thought-provoking adventures in the fascinating realm of number theory. Mr. Friedberg is currently Professor of Physics at Barnard College, where he is Chairman of the Department of Physics and Astronomy.
An Algebraic Approach to Geometry: Geometric Trilogy II
by Francis BorceuxThis is a unified treatment of the various algebraic approaches to geometric spaces. The study of algebraic curves in the complex projective plane is the natural link between linear geometry at an undergraduate level and algebraic geometry at a graduate level, and it is also an important topic in geometric applications, such as cryptography. 380 years ago, the work of Fermat and Descartes led us to study geometric problems using coordinates and equations. Today, this is the most popular way of handling geometrical problems. Linear algebra provides an efficient tool for studying all the first degree (lines, planes) and second degree (ellipses, hyperboloids) geometric figures, in the affine, the Euclidean, the Hermitian and the projective contexts. But recent applications of mathematics, like cryptography, need these notions not only in real or complex cases, but also in more general settings, like in spaces constructed on finite fields. And of course, why not also turn our attention to geometric figures of higher degrees? Besides all the linear aspects of geometry in their most general setting, this book also describes useful algebraic tools for studying curves of arbitrary degree and investigates results as advanced as the Bezout theorem, the Cramer paradox, topological group of a cubic, rational curves etc. Hence the book is of interest for all those who have to teach or study linear geometry: affine, Euclidean, Hermitian, projective; it is also of great interest to those who do not want to restrict themselves to the undergraduate level of geometric figures of degree one or two.
An Algebraic Approach to the Many-Electron Problem (SpringerBriefs in Physics)
by Jaroslav Zamastil Tereza UhlířováThis book presents an algebraic approach to the coupled cluster method for many-electron systems, pioneered by Josef Paldus. Using field methods along with an algebraic, rather than diagrammatic, approach facilitates a way of deriving the coupled cluster method which is readily understandable at the graduate level. The book begins with the notion of the quantized electron field and shows how the N-electron Hamiltonian can be expressed in its language. This is followed by introduction of the Fermi vacuum and derivation of the Hartree-Fock equations along with conditions for stability of their solutions. Following this groundwork, the book discusses a method of configuration interaction to account for dynamical correlations between electrons, pointing out the size-extensivity problem, and showing how this problem is solved with the coupled cluster approach. This is followed by derivation of the coupled cluster equations in spin-orbital form. Finally, the book explores practical aspects, showing how one may take advantage of permutational and spin symmetries, and how to solve coupled-cluster equations, illustrated by the Hubbard model of benzene, the simplest quasi-realistic model of electron correlation.
An Algebraic Introduction to K-Theory
by Bruce A. MagurnThis is an introduction to algebraic K-theory with no prerequisite beyond a first semester of algebra (including Galois theory and modules over a principal ideal domain). The presentation is almost entirely self-contained, and is divided into short sections with exercises to reinforce the ideas and suggest further lines of inquiry. No experience with analysis, geometry, number theory or topology is assumed. Within the context of linear algebra, K-theory organises and clarifies the relations among ideal class groups, group representations, quadratic forms, dimensions of a ring, determinants, quadratic reciprocity and Brauer groups of fields. By including introductions to standard algebra topics (tensor products, localisation, Jacobson radical, chain conditions, Dedekind domains, semi-simple rings, exterior algebras), the author makes algebraic K-theory accessible to first-year graduate students and other mathematically sophisticated readers. Even if your algebra is rusty, you can read this book; the necessary background is here, with proofs.
An Analytical Mechanics Framework for Flow-Oscillator Modeling of Vortex-Induced Bluff-Body Oscillations (Solid Mechanics and Its Applications #260)
by Haym Benaroya Sohrob Mottaghi Rene GabbaiThis self-contained book provides an introduction to the flow-oscillator modeling of vortex-induced bluff-body oscillations. One of the great challenges in engineering science also happens to be one of engineering design – the modeling, analysis and design of vibrating structures driven by fluid motion. The literature on fluid–structure interaction is vast, and it can be said to comprise a large fraction of all papers published in the mechanical sciences. This book focuses on the vortex-induced oscillations of an immersed body, since, although the importance of the subject has long been known, it is only during the past fifty years that there have been concerted efforts to analytically model the general behavior of the coupling between vortex shedding and structural oscillations. At the same time, experimentalists have been gathering data on such interactions in order to help define the various regimes of behavior. This data is critical to our understanding and to those who develop analytical models, as can be seen in this book. The fundamental bases for the modeling developed in this book are the variational principles of analytical dynamics, in particular Hamilton’s principle and Jourdain’s principle, considered great intellectual achievements on par with Newton’s laws of motion. Variational principles have been applied in numerous disciplines, including dynamics, optics and quantum mechanics. Here, we apply variational principles to the development of a framework for the modeling of flow-oscillator models of vortex-induced oscillations.