- Table View
- List View
Representation Theory and Harmonic Analysis of Wreath Products of Finite Groups
by CeccheriniThis book presents an introduction to the representation theory of wreath products of finite groups and harmonic analysis on the corresponding homogeneous spaces. The reader will find a detailed description of the theory of induced representations and Clifford theory, focusing on a general formulation of the little group method. This provides essential tools for the determination of all irreducible representations of wreath products of finite groups. The exposition also includes a detailed harmonic analysis of the finite lamplighter groups, the hyperoctahedral groups, and the wreath product of two symmetric groups. This relies on the generalised Johnson scheme, a new construction of finite Gelfand pairs. The exposition is completely self-contained and accessible to anyone with a basic knowledge of representation theory. Plenty of worked examples and several exercises are provided, making this volume an ideal textbook for graduate students. It also represents a useful reference for more experienced researchers.
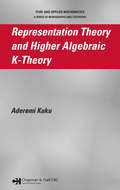
Representation Theory and Higher Algebraic K-Theory
by Aderemi KukuRepresentation Theory and Higher Algebraic K-Theory is the first book to present higher algebraic K-theory of orders and group rings as well as characterize higher algebraic K-theory as Mackey functors that lead to equivariant higher algebraic K-theory and their relative generalizations. Thus, this book makes computations of higher K-theory of grou
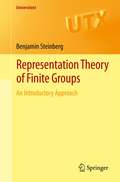
Representation Theory of Finite Groups
by Benjamin SteinbergThis book is intended to present group representation theory at a level accessible to mature undergraduate students and beginning graduate students. This is achieved by mainly keeping the required background to the level of undergraduate linear algebra, group theory and very basic ring theory. Module theory and Wedderburn theory, as well as tensor products, are deliberately avoided. Instead, we take an approach based on discrete Fourier Analysis. Applications to the spectral theory of graphs are given to help the student appreciate the usefulness of the subject. A number of exercises are included. This book is intended for a 3rd/4th undergraduate course or an introductory graduate course on group representation theory. However, it can also be used as a reference for workers in all areas of mathematics and statistics.
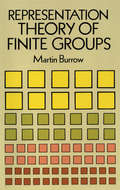
Representation Theory of Finite Groups
by Martin BurrowConcise, graduate-level exposition of the theory of finite groups, including the theory of modular representations. Topics include representation theory of rings with identity, representation theory of finite groups, applications of the theory of characters, construction of irreducible representations and modular representations. Rudiments of linear algebra and knowledge of group theory helpful prerequisites. Exercises. Bibliography. Appendix. 1965 edition.
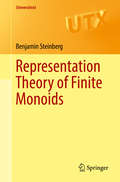
Representation Theory of Finite Monoids
by Benjamin SteinbergThis first text on the subject provides a comprehensive introduction to the representation theory of finite monoids. Carefully worked examples and exercises provide the bells and whistles for graduate accessibility, bringing a broad range of advanced readers to the forefront of research in the area. Highlights of the text include applications to probability theory, symbolic dynamics, and automata theory. Comfort with module theory, a familiarity with ordinary group representation theory, and the basics of Wedderburn theory, are prerequisites for advanced graduate level study. Researchers in algebra, algebraic combinatorics, automata theory, and probability theory, will find this text enriching with its thorough presentation of applications of the theory to these fields. Prior knowledge of semigroup theory is not expected for the diverse readership that may benefit from this exposition. The approach taken in this book is highly module-theoretic and follows the modern flavor of the theory of finite dimensional algebras. The content is divided into 7 parts. Part I consists of 3 preliminary chapters with no prior knowledge beyond group theory assumed. Part II forms the core of the material giving a modern module-theoretic treatment of the Clifford -Munn-Ponizovskii theory of irreducible representations. Part III concerns character theory and the character table of a monoid. Part IV is devoted to the representation theory of inverse monoids and categories and Part V presents the theory of the Rhodes radical with applications to triangularizability. Part VI features 3 chapters devoted to applications to diverse areas of mathematics and forms a high point of the text. The last part, Part VII, is concerned with advanced topics. There are also 3 appendices reviewing finite dimensional algebras, group representation theory, and M#65533;bius inversion.
Representation Theory of Symmetric Groups (Discrete Mathematics and Its Applications)
by Pierre-Loic MeliotRepresentation Theory of Symmetric Groups is the most up-to-date abstract algebra book on the subject of symmetric groups and representation theory. Utilizing new research and results, this book can be studied from a combinatorial, algorithmic or algebraic viewpoint. This book is an excellent way of introducing today’s students to representation theory of the symmetric groups, namely classical theory. From there, the book explains how the theory can be extended to other related combinatorial algebras like the Iwahori-Hecke algebra. In a clear and concise manner, the author presents the case that most calculations on symmetric group can be performed by utilizing appropriate algebras of functions. Thus, the book explains how some Hopf algebras (symmetric functions and generalizations) can be used to encode most of the combinatorial properties of the representations of symmetric groups. Overall, the book is an innovative introduction to representation theory of symmetric groups for graduate students and researchers seeking new ways of thought.
Representation Theory of the Symmetric Groups
by Tullio Ceccherini-Silberstein Fabio Scarabotti Filippo TolliA self-contained introduction to the representation theory of the symmetric groups, including an exhaustive exposition of the Okounkov Vershik approach.
Representation Theory, Number Theory, and Invariant Theory: In Honor Of Roger Howe On The Occasion Of His 70th Birthday (Progress In Mathematics Ser. #323)
by Jim Cogdell Ju-Lee Kim Chen-Bo ZhuThis book contains selected papers based on talks given at the "Representation Theory, Number Theory, and Invariant Theory" conference held at Yale University from June 1 to June 5, 2015. The meeting and this resulting volume are in honor of Professor Roger Howe, on the occasion of his 70th birthday, whose work and insights have been deeply influential in the development of these fields. The speakers who contributed to this work include Roger Howe's doctoral students, Roger Howe himself, and other world renowned mathematicians. Topics covered include automorphic forms, invariant theory, representation theory of reductive groups over local fields, and related subjects.
Representations and Characters of Groups
by Gordon James Martin LiebeckThis is the second edition of the popular textbook on representation theory of finite groups. The authors have revised the text greatly and included new chapters on Characters of GL(2,q) and Permutations and Characters. The theory is developed in terms of modules, since this is appropriate for more advanced work, but considerable emphasis is placed upon constructing characters. The character tables of many groups are given, including all groups of order less than 32, and all but one of the simple groups of order less than 1000. Each chapter is accompanied by a variety of exercises, and full solutions to all the exercises are provided at the end of the book.
Representations and Nilpotent Orbits of Lie Algebraic Systems: In Honour of the 75th Birthday of Tony Joseph (Progress in Mathematics #330)
by Anna Melnikov Maria Gorelik Vladimir HinichThis volume, a celebration of Anthony Joseph’s fundamental influence on classical and quantized representation theory, explores a wide array of current topics in Lie theory by experts in the area. The chapters are based on the 2017 sister conferences titled “Algebraic Modes of Representations,” the first of which was held from July 16-18 at the Weizmann Institute of Science and the second from July 19-23 at the University of Haifa. The chapters in this volume cover a range of topics, including:Primitive idealsInvariant theoryGeometry of Lie group actionsQuantum affine algebrasYangiansCategorificationVertex algebrasThis volume is addressed to mathematicians who specialize in representation theory and Lie theory, and who wish to learn more about this fascinating subject.
Representations of Algebras
by Flávio Ulhoa Coelho Héctor A. MerklenThis volume contains the proceedings of the Conference on Representations of Algebras - Sao Paulo (CRASP), held at the Instituto de Matematica e Estatistica of the Universidade de Sao Paulo, Brazil. It discusses Hopf, tubular, quasischurian, wild hereditary, concealed-canonical Artin, Brauer star, and Koszul algebras.
Representations of Elementary Abelian p-Groups and Vector Bundles
by David J. BensonQuestions about modular representation theory of finite groups can often be reduced to elementary abelian subgroups. This is the first book to offer a detailed study of the representation theory of elementary abelian groups, bringing together information from many papers and journals, as well as unpublished research. Special attention is given to recent work on modules of constant Jordan type, and the methods involve producing and examining vector bundles on projective space and their Chern classes. Extensive background material is provided, which will help the reader to understand vector bundles and their Chern classes from an algebraic point of view, and to apply this to modular representation theory of elementary abelian groups. The final section, addressing problems and directions for future research, will also help to stimulate further developments in the subject. With no similar books on the market, this will be an invaluable resource for graduate students and researchers working in representation theory.
Representations of Finite Groups of Lie Type (London Mathematical Society Student Texts #95)
by François Digne Jean MichelOn its original publication, this book provided the first elementary treatment of representation theory of finite groups of Lie type in book form. This second edition features new material to reflect the continuous evolution of the subject, including entirely new chapters on Hecke algebras, Green functions and Lusztig families. The authors cover the basic theory of representations of finite groups of Lie type, such as linear, unitary, orthogonal and symplectic groups. They emphasise the Curtis–Alvis duality map and Mackey's theorem and the results that can be deduced from it, before moving on to a discussion of Deligne–Lusztig induction and Lusztig's Jordan decomposition theorem for characters. The book contains the background information needed to make it a useful resource for beginning graduate students in algebra as well as seasoned researchers. It includes exercises and explicit examples.
Representations of Lie Algebras
by Anthony HendersonThis bold and refreshing approach to Lie algebras assumes only modest prerequisites (linear algebra up to the Jordan canonical form and a basic familiarity with groups and rings), yet it reaches a major result in representation theory: the highest-weight classification of irreducible modules of the general linear Lie algebra. The author's exposition is focused on this goal rather than aiming at the widest generality and emphasis is placed on explicit calculations with bases and matrices. The book begins with a motivating chapter explaining the context and relevance of Lie algebras and their representations and concludes with a guide to further reading. Numerous examples and exercises with full solutions are included. Based on the author's own introductory course on Lie algebras, this book has been thoroughly road-tested by advanced undergraduate and beginning graduate students and it is also suited to individual readers wanting an introduction to this important area of mathematics.
Representations of SU (Lecture Notes in Mathematics #2340)
by Roelof W. Bruggeman Roberto J. MiatelloThis book studies the modules arising in Fourier expansions of automorphic forms, namely Fourier term modules on SU(2,1), the smallest rank one Lie group with a non-abelian unipotent subgroup. It considers the “abelian” Fourier term modules connected to characters of the maximal unipotent subgroups of SU(2,1), and also the “non-abelian” modules, described via theta functions. A complete description of the submodule structure of all Fourier term modules is given, with a discussion of the consequences for Fourier expansions of automorphic forms, automorphic forms with exponential growth included.These results can be applied to prove a completeness result for Poincaré series in spaces of square integrable automorphic forms.Aimed at researchers and graduate students interested in automorphic forms, harmonic analysis on Lie groups, and number-theoretic topics related to Poincaré series, the book will also serve as a basic reference on spectral expansion with Fourier-Jacobi coefficients. Only a background in Lie groups and their representations is assumed.
Representations of Solvable Lie Groups: Basic Theory and Examples (New Mathematical Monographs #39)
by Didier Arnal Bradley CurreyThe theory of unitary group representations began with finite groups, and blossomed in the twentieth century both as a natural abstraction of classical harmonic analysis, and as a tool for understanding various physical phenomena. Combining basic theory and new results, this monograph is a fresh and self-contained exposition of group representations and harmonic analysis on solvable Lie groups. Covering a range of topics from stratification methods for linear solvable actions in a finite-dimensional vector space, to complete proofs of essential elements of Mackey theory and a unified development of the main features of the orbit method for solvable Lie groups, the authors provide both well-known and new examples, with a focus on those relevant to contemporary applications. Clear explanations of the basic theory make this an invaluable reference guide for graduate students as well as researchers.
Representations of the Infinite Symmetric Group
by Alexei Borodin Grigori OlshanskiRepresentation theory of big groups is an important and quickly developing part of modern mathematics, giving rise to a variety of important applications in probability and mathematical physics. This book provides the first concise and self-contained introduction to the theory on the simplest yet very nontrivial example of the infinite symmetric group, focusing on its deep connections to probability, mathematical physics, and algebraic combinatorics. Following a discussion of the classical Thoma's theorem which describes the characters of the infinite symmetric group, the authors describe explicit constructions of an important class of representations, including both the irreducible and generalized ones. Complete with detailed proofs, as well as numerous examples and exercises which help to summarize recent developments in the field, this book will enable graduates to enhance their understanding of the topic, while also aiding lecturers and researchers in related areas.
Representative Points of Statistical Distributions: Applications in Statistical Inference
by Kai-Tai Fang Huajun Ye Yongdao ZhouStatistical simulation has become a cornerstone in statistical research and applications. The aim of Representative Points of Statistical Distributions: Applications in Statistical Inference is to present a comprehensive exploration of various methods for statistical simulation and resampling, focusing on consistency and efficiency. It covers a range of representative points (RPs) – Monte Carlo (MC) RPs, quasi-Monte Carlo (QMC) RPs, and mean square error (MSE) RPs – and their applications, and includes a collection of recent developments in the field. It also explores other types of representative points and the corresponding approximate distributions, and delves into the realm of statistical simulation by exploring the limitations of traditional MC methods and the innovations brought about by the bootstrap method. In addition, the text introduces other kinds of representative points and the corresponding approximate distributions such as QMC and MSE methods.Features Comprehensive exploration of statistical simulation methods: provides a deep dive into MC methods and bootstrap methods, and introduces other kinds of RPs and the corresponding approximate distributions, such as QMC and MSE methods. Emphasis on consistency and efficiency: highlights the advantages of these methods in terms of consistency and efficiency, addressing the slow convergence rate of classical statistical simulation. Collection of recent developments: brings together the latest advancements in the field of statistical simulation, keeping readers up to date with the most current research. Practical applications: includes numerous practical applications of various types of RPs (MC-RPs, QMC-RPs, and MSE-RPs) in statistical inference and simulation. Educational resource: can serve as a textbook for postgraduate students, a reference book for undergraduate students, and a valuable resource for professionals in various fields. The book serves as a valuable resource for postgraduate students, researchers, and practitioners in statistics, mathematics, and other quantitative fields.
Representing Finite Groups
by Ambar N. SenguptaThis graduate textbook presents the basics of representation theory for finite groups from the point of view of semisimple algebras and modules over them. The presentation interweaves insights from specific examples with development of general and powerful tools based on the notion of semisimplicity. The elegant ideas of commutant duality are introduced, along with an introduction to representations of unitary groups. The text progresses systematically and the presentation is friendly and inviting. Central concepts are revisited and explored from multiple viewpoints. Exercises at the end of the chapter help reinforce the material. Representing Finite Groups: A Semisimple Introduction would serve as a textbook for graduate and some advanced undergraduate courses in mathematics. Prerequisites include acquaintance with elementary group theory and some familiarity with rings and modules. A final chapter presents a self-contained account of notions and results in algebra that are used. Researchers in mathematics and mathematical physics will also find this book useful. A separate solutions manual is available for instructors.
Reproducibility: Principles, Problems, Practices, and Prospects
by Sabine Maasen Harald Atmanspacher"A comprehensive, insightful treatment of the reproducibility challenges facing science today and of ways in which the scientific community can address them." - Kathleen Hall Jamieson, Elizabeth Ware Packard Professor of Communication, University of Pennsylvania "How can we make sure that reproducible research remains a key imperative of scientific communication under increasing commercialization, media attention, and publication pressure? This handbook offers the first interdisciplinary and fundamental treatment of this important question." - Torsten Hothorn, Professor of Biostatistics, University of Zurich Featuring peer-reviewed contributions from noted experts in their fields of research, Reproducibility: Principles, Problems, Practices, and Prospects presents state-of-the-art approaches to reproducibility, the gold standard of sound science, from multi- and interdisciplinary perspectives. Including comprehensive coverage for implementing and reflecting the norm of reproducibility in various pertinent fields of research, the book focuses on how the reproducibility of results is applied, how it may be limited, and how such limitations can be understood or even controlled in the natural sciences, computational sciences, life sciences, social sciences, and studies of science and technology. The book presents many chapters devoted to a variety of methods and techniques, as well as their epistemic and ontological underpinnings, which have been developed to safeguard reproducible research and curtail deficits and failures. The book also investigates the political, historical, and social practices that underlie reproducible research in contemporary science studies, including the difficulties of good scientific practice and the ethos of reproducibility in modern innovation societies. Reproducibility: Principles, Problems, Practices, and Prospects is a guide for researchers who are interested in the general and overarching questions behind the concept of reproducibility; for active scientists who are confronted with practical reproducibility problems in their everyday work; and for economic stakeholders and political decision makers who need to better understand the challenges of reproducibility. In addition, the book is a useful in-depth primer for undergraduate and graduate-level courses in scientific methodology and basic issues in the philosophy and sociology of science from a modern perspective.
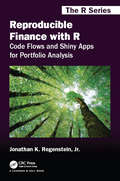
Reproducible Finance with R: Code Flows and Shiny Apps for Portfolio Analysis (Chapman & Hall/CRC The R Series)
by Jonathan K. Regenstein Jr.<p>Reproducible Finance with R: Code Flows and Shiny Apps for Portfolio Analysis is a unique introduction to data science for investment management that explores the three major R/finance coding paradigms, emphasizes data visualization, and explains how to build a cohesive suite of functioning Shiny applications. The full source code, asset price data and live Shiny applications are available at reproduciblefinance.com. <p>The ideal reader works in finance or wants to work in finance and has a desire to learn R code and Shiny through simple, yet practical real-world examples. <p>The book begins with the first step in data science: importing and wrangling data, which in the investment context means importing asset prices, converting to returns, and constructing a portfolio. The next section covers risk and tackles descriptive statistics such as standard deviation, skewness, kurtosis, and their rolling histories. The third section focuses on portfolio theory, analyzing the Sharpe Ratio, CAPM, and Fama French models. The book concludes with applications for finding individual asset contribution to risk and for running Monte Carlo simulations. For each of these tasks, the three major coding paradigms are explored and the work is wrapped into interactive Shiny dashboards.</p>
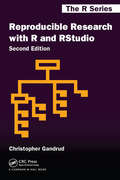
Reproducible Research with R and R Studio (Chapman & Hall/CRC The R Series #13)
by Christopher GandrudAll the Tools for Gathering and Analyzing Data and Presenting Results Reproducible Research with R and RStudio, Second Edition brings together the skills and tools needed for doing and presenting computational research. Using straightforward examples, the book takes you through an entire reproducible research workflow. This practical workflow enables you to gather and analyze data as well as dynamically present results in print and on the web. New to the Second Edition The rmarkdown package that allows you to create reproducible research documents in PDF, HTML, and Microsoft Word formats using the simple and intuitive Markdown syntax Improvements to RStudio’s interface and capabilities, such as its new tools for handling R Markdown documents Expanded knitr R code chunk capabilities The kable function in the knitr package and the texreg package for dynamically creating tables to present your data and statistical results An improved discussion of file organization, enabling you to take full advantage of relative file paths so that your documents are more easily reproducible across computers and systems The dplyr, magrittr, and tidyr packages for fast data manipulation Numerous modifications to R syntax in user-created packages Changes to GitHub’s and Dropbox’s interfaces Create Dynamic and Highly Reproducible Research This updated book provides all the tools to combine your research with the presentation of your findings. It saves you time searching for information so that you can spend more time actually addressing your research questions. Supplementary files used for the examples and a reproducible research project are available on the author’s website.
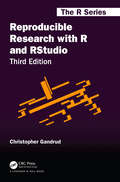
Reproducible Research with R and RStudio (Chapman & Hall/CRC The R Series)
by Christopher GandrudPraise for previous editions:"Gandrud has written a great outline of how a fully reproducible research project should look from start to finish, with brief explanations of each tool that he uses along the way… Advanced undergraduate students in mathematics, statistics, and similar fields as well as students just beginning their graduate studies would benefit the most from reading this book. Many more experienced R users or second-year graduate students might find themselves thinking, ‘I wish I’d read this book at the start of my studies, when I was first learning R!’…This book could be used as the main text for a class on reproducible research …" (The American Statistician) Reproducible Research with R and R Studio, Third Edition brings together the skills and tools needed for doing and presenting computational research. Using straightforward examples, the book takes you through an entire reproducible research workflow. This practical workflow enables you to gather and analyze data as well as dynamically present results in print and on the web. Supplementary materials and example are available on the author’s website. New to the Third Edition Updated package recommendations, examples, URLs, and removed technologies no longer in regular use. More advanced R Markdown (and less LaTeX) in discussions of markup languages and examples. Stronger focus on reproducible working directory tools. Updated discussion of cloud storage services and persistent reproducible material citation. Added discussion of Jupyter notebooks and reproducible practices in industry. Examples of data manipulation with Tidyverse tibbles (in addition to standard data frames) and pivot_longer() and pivot_wider() functions for pivoting data. Features Incorporates the most important advances that have been developed since the editions were published Describes a complete reproducible research workflow, from data gathering to the presentation of results Shows how to automatically generate tables and figures using R Includes instructions on formatting a presentation document via markup languages Discusses cloud storage and versioning services, particularly Github Explains how to use Unix-like shell programs for working with large research projects
Reproduction and Social Organization in Sub-Saharan Africa (Studies in Demography #4)
by Ron J. LesthaegheUnlike most Asian and Latin American countries, sub-Saharan Africa has seen both an increase in population growth rates and a weakening of traditional patterns of child-spacing since the 1960s. It is tempting to conclude that sub-Saharan countries have simply not reached adequate levels of income, education, and urbanization for a fertility decline to occur. This book argues, however, that such a socioeconomic threshold hypothesis will not provide an adequate basis for comparison. These authors take the view that any reproductive regime is also anchored to a broader pattern of social organization, including the prevailing modes of production, rules of exchange, patterns of religious systems, kinship structure, division of labor, and gender roles. They link the characteristic features of the African reproductive regime with regard to nuptiality, polygyny, breastfeeding, postpartum abstinence, sterility, and child-fostering to other specifically African characteristics of social organization and culture. Substantial attention is paid to the heterogeneity that prevails among sub-Saharan societies and considerable use is made, therefore, of interethnic comparisons. As a result the book goes considerably beyond mere demographic description and builds bridges between demography and anthropology or sociology. This title is part of UC Press's Voices Revived program, which commemorates University of California Press’s mission to seek out and cultivate the brightest minds and give them voice, reach, and impact. Drawing on a backlist dating to 1893, Voices Revived makes high-quality, peer-reviewed scholarship accessible once again using print-on-demand technology. This title was originally published in 1989.
Reproductive Decision-Making in a Macro-Micro Perspective
by Dimiter Philipov Aart C. Liefbroer Jane E. KlobasThis book provides new insights into the significant gap that currently exists between desired and actual fertility in Europe. It examines how people make decisions about having children and demonstrates how the macro-level environment affects micro-level decision-making. Written by an international team of leading demographers and psychologists, the book presents the theoretical and methodological developments of a three-year, European Commission-funded project named REPRO (Reproductive Decision-Making in a Macro-Micro Perspective). It also provides an overview of the research conducted by REPRO researchers both during and after the project. The book examines fertility intentions from quantitative and qualitative perspectives, demonstrates how the macro-level environment affects micro-level decision-making, and offers a multi-level analysis of fertility-related norms across Europe. Overall, this book offers insight into how people make decisions to have children, when they are most likely to act on their decisions, and how different social and policy settings affect their decisions and actions. It will appeal to researchers, graduate students, and policy advisors with an interest in fertility, demography, and life-course decision making.

