- Table View
- List View
Research on Reasoning with Data and Statistical Thinking: International Perspectives (Advances in Mathematics Education)
by Gail F. Burrill Leandro de Oliveria Souza Enriqueta RestonThis book is derived from selected papers from the Fourteenth International Congress on Mathematical Education Topic Study Group 12, Teaching and Learning Statistics. It describes recent research on curriculum, pedagogy and outreach initiatives from countries as diverse as Brazil, Chile, Columbia, Denmark, Germany, the Netherlands, Spain, Sweden, Thailand, Turkey, the United Kingdom, and the United States. The book has a focus on the use of data in the teaching and learning of statistics across grade levels and begins with an overview of the status of statistics education and the use of data from seven different countries across the continents and the link between research and practice in those countries. Because it contains specific examples of the research, for example, on the ways children learn, the choice and implementation of tasks, or the role of informal inference, the book will be a great resource to those interested and involved in the teaching of statistics, curriculum developers, and statistics education researchers.
Research on Risk Evaluation Methods of Groundwater Bursting from Aquifers Underlying Coal Seams and Applications to Coalfields of North China (Springer Theses)
by Yifan ZengThis book provides an information fusion model with information fusion theory, geographic information system technology and modern mathematical methods to evaluate the risks of groundwater inrushes from aquifers underlying coal seams. In this new model, the water inrush vulnerable index was calculated with variable weights theory. It overcomes the defect of the traditional vulnerability index method that assumes constant weights for the factors controlling the water inrush. Mine water inrush events often occur during coal mine construction and production; they account for a large proportion of the nation’s coal mine disasters and accidents in China. Between 2005 and 2014, 513 water inrush incidents have occurred with a total loss of 2,753 lives. As mining depths and mining intensity continue to increase, the hydrogeological conditions encountered are becoming more complex. The innovative model presented here was applied to two coal mines in China with proved better results than the traditional vulnerability index method.
Research on Ship Design and Optimization Based on Simulation-Based Design (SBD) Technique
by Sheng-Long Zhang Bao-Ji ZhangShip optimization design is critical to the preliminary design of a ship. With the rapid development of computer technology, the simulation-based design (SBD) technique has been introduced into the field of ship design. Typical SBD consists of three parts: geometric reconstruction; CFD numerical simulation; and optimization. In the context of ship design, these are used to alter the shape of the ship, evaluate the objective function and to assess the hull form space respectively. As such, the SBD technique opens up new opportunities and paves the way for a new method for optimal ship design. This book discusses the problem of optimizing ship’s hulls, highlighting the key technologies of ship optimization design and presenting a series of hull-form optimization platforms. It includes several improved approaches and novel ideas with significant potential in this field
Research on Teaching and Learning Mathematics at the Tertiary Level
by Irene Biza Victor Giraldo Reinhard Hochmuth Azimeh Sadat Khakbaz Chris RasmussenThis topical survey focuses on research in tertiary mathematics education, a field that has experienced considerable growth over the last 10 years. Drawing on the most recent journal publications as well as the latest advances from recent high-quality conference proceedings, our review culls out the following five emergent areas of interest: mathematics teaching at the tertiary level; the role of mathematics in other disciplines; textbooks, assessment and students studying practices; transition to the tertiary level; and theoretical-methodological advances. We conclude the survey with a discussion of some potential directions for future research in this new and rapidly evolving domain of inquiry. "
Research on Teaching and Learning Probability
by Carmen Batanero Egan J. J. Chernoff Joachim Engel Hollylynne S. S. Lee Ernesto SánchezThis book summarizes the vast amount of research related to teaching and learning probability that has been conducted for more than 50 years in a variety of disciplines. It begins with a synthesis of the most important probability interpretations throughout history: intuitive, classical, frequentist, subjective, logical propensity and axiomatic views. It discusses their possible applications, philosophical problems, as well as their potential and the level of interest they enjoy at different educational levels. Next, the book describes the main features of probabilistic thinking and reasoning, including the contrast to classical logic, probability language features, the role of intuitions, as well as paradoxes and the relevance of modeling. It presents an analysis of the differences between conditioning and causation, the variability expression in data as a sum of random and causal variations, as well as those of probabilistic versus statistical thinking. This is followed by an analysis of probability s role and main presence in school curricula and an outline of the central expectations in recent curricular guidelines at the primary, secondary and high school level in several countries. This book classifies and discusses in detail the three different research periods on students and people s intuitions and difficulties concerning probability: early research focused on cognitive development, a period of heuristics and biases programs, and the current period marked by a multitude of foci, approaches and theoretical frameworks. "
Research on the Key Technologies in Narrowband Interference and Impulsive Noise Mitigation and Cancellation (Springer Theses)
by Sicong LiuThis book summarizes the authors’ latest research on narrowband interference and impulsive noise mitigation and cancelation, including (i) mitigating the impacts of NBI on synchronization; (ii) improving time-frequency interleaving performance under NBI and IN; (iii) accurately recovering and eliminating NBI and IN. The complicated, random and intensive narrowband interference and impulsive noise are a serious bottleneck of the next-generation wireless communications and Internet of things. This book also proposes effective and novel frameworks and algorithms, which will significantly improve the capability of mitigating and eliminating NBI and IN in the next-generation broadband communications systems.This book not only presents thorough theoretical models and algorithm design guidelines, but also provides adequate simulation and experimental engineering methods and results. The book is a valuable reference for those engaged in theoretical study, algorithm design and engineering practice in related fields, such as wireless communications, smart lighting, IoT and smart grid communications.
Research Problems in Function Theory: Fiftieth Anniversary Edition (Problem Books in Mathematics)
by Walter K. Hayman Eleanor F. LinghamIn 1967 Walter K. Hayman published ‘Research Problems in Function Theory’, a list of 141 problems in seven areas of function theory. In the decades following, this list was extended to include two additional areas of complex analysis, updates on progress in solving existing problems, and over 520 research problems from mathematicians worldwide. It became known as ‘Hayman's List’. This Fiftieth Anniversary Edition contains the complete ‘Hayman's List’ for the first time in book form, along with 31 new problems by leading international mathematicians. This list has directed complex analysis research for the last half-century, and the new edition will help guide future research in the subject. The book contains up-to-date information on each problem, gathered from the international mathematics community, and where possible suggests directions for further investigation. Aimed at both early career and established researchers, this book provides the key problems and results needed to progress in the most important research questions in complex analysis, and documents the developments of the past 50 years.
Research Schools on Number Theory in India: During the 20th Century
by Purabi MukherjiThis book is an attempt to describe the gradual development of the major schools of research on number theory in South India, Punjab, Mumbai, Bengal, and Bihar—including the establishment of Tata Institute of Fundamental Research (TIFR), Mumbai, a landmark event in the history of research of number theory in India. Research on number theory in India during modern times started with the advent of the iconic genius Srinivasa Ramanujan, inspiring mathematicians around the world. This book discusses the national and international impact of the research made by Indian number theorists. It also includes a carefully compiled, comprehensive bibliography of major 20th century Indian number theorists making this book important from the standpoint of historic documentation and a valuable resource for researchers of the field for their literature survey. This book also briefly discusses the importance of number theory in the modern world of mathematics, including applications of the results developed by indigenous number theorists in practical fields. Since the book is written from the viewpoint of the history of science, technical jargon and mathematical expressions have been avoided as much as possible.
Research Software Engineering: A Guide to the Open Source Ecosystem (Chapman & Hall/CRC Data Science Series)
by Matthias BannertResearch Software Engineering: A Guide to the Open Source Ecosystem strives to give a big-picture overview and an understanding of the opportunities of programming as an approach to analytics and statistics. The book argues that a solid "programming" skill level is not only well within reach for many but also worth pursuing for researchers and business analysts. The ability to write a program leverages field-specific expertise and fosters interdisciplinary collaboration as source code continues to become an important communication channel. Given the pace of the development in data science, many senior researchers and mentors, alongside non-computer science curricula lack a basic software engineering component. This book fills the gap by providing a dedicated programming-with-data resource to both academic scholars and practitioners.Key Features overview: breakdown of complex data science software stacks into core components applied: source code of figures, tables and examples available and reproducible solely with license cost-free, open source software reader guidance: different entry points and rich references to deepen the understanding of selected aspects
Research Software Engineering with Python: Building software that makes research possible
by Damien Irving Kate Hertweck Luke Johnston Joel Ostblom Charlotte Wickham Greg WilsonWriting and running software is now as much a part of science as telescopes and test tubes, but most researchers are never taught how to do either well. As a result, it takes them longer to accomplish simple tasks than it should, and it is harder for them to share their work with others than it needs to be. This book introduces the concepts, tools, and skills that researchers need to get more done in less time and with less pain. Based on the practical experiences of its authors, who collectively have spent several decades teaching software skills to scientists, it covers everything graduate-level researchers need to automate their workflows, collaborate with colleagues, ensure that their results are trustworthy, and publish what they have built so that others can build on it. The book assumes only a basic knowledge of Python as a starting point, and shows readers how it, the Unix shell, Git, Make, and related tools can give them more time to focus on the research they actually want to do. Research Software Engineering with Python can be used as the main text in a one-semester course or for self-guided study. A running example shows how to organize a small research project step by step; over a hundred exercises give readers a chance to practice these skills themselves, while a glossary defining over two hundred terms will help readers find their way through the terminology. All of the material can be re-used under a Creative Commons license, and all royalties from sales of the book will be donated to The Carpentries, an organization that teaches foundational coding and data science skills to researchers worldwide.
Research Studies on Learning and Teaching of Mathematics: Dedicated to Edward A. Silver (Research in Mathematics Education)
by Jinfa Cai Gabriel J. Stylianides Patricia Ann KenneyThis book is about promising research advancements that sparked directly or indirectly from intellectual contributions by distinguished internationally recognized mathematics educator and researcher, Edward A. Silver. The features of this book include:A focus on the research areas that have benefited from Dr. Silver’s intellectual contributions and influence, such as designing instructional tasks, problem posing, problem solving, preservice teacher learning, in service teacher professional development, and mathematics assessmentChapters written by contributors who at one time were his doctoral or post-doctoral colleagues along with any invited co-authorsA brief bio of Dr. Silver showing his intellectual journey, key milestones in his career, and scholarly accomplishments that sparked from his intellectual contributions
Research Topics in Analysis, Volume II: Applications (Birkhäuser Advanced Texts Basler Lehrbücher)
by Nikolaos S. Papageorgiou Shouchuan HuThis book, the second of two volumes, presents significant applications for understanding modern analysis. It empowers young researchers with key techniques and applications to explore various subfields of this broad subject and introduces relevant frameworks for immediate deployment. The applications list begins with Degree Theory, a useful tool for studying nonlinear equations. Chapter 2 deals with Fixed Point Theory, and Chapter 3 introduces Critical Point Theory. Chapter 4 presents the main spectral properties of linear, nonlinear, anisotropic, and double-phase differential operators. Chapter 5 covers semilinear and nonlinear elliptic equations with different boundary conditions, while Chapter 6 addresses dynamic systems monitored by ordinary and partial differential equations. Chapter 7 delves into optimal control problems, and Chapter 8 discusses some economic models, providing a brief presentation of Game Theory and Nash equilibrium. By offering a clear and comprehensive overview of modern analysis tools and applications, this work can greatly benefit mature graduate students seeking research topics, as well as experienced researchers interested in this vast and rich field of mathematics.
Research Trends in Graph Theory and Applications (Association for Women in Mathematics Series #25)
by Daniela Ferrero Leslie Hogben Sandra R. Kingan Gretchen L. MatthewsThe Workshop for Women in Graph Theory and Applications was held at the Institute for Mathematics and Its Applications (University of Minnesota, Minneapolis) on August 19-23, 2019. During this five-day workshop, 42 participants performed collaborative research, in six teams, each focused on open problems in different areas of graph theory and its applications. The research work of each team was led by two experts in the corresponding area, who prior to the workshop, carefully selected relevant and meaningful open problems that would yield high-quality research and results of strong impact. As a result, all six teams have made significant contributions to several open problems in their respective areas. The workshop led to the creation of the Women in Graph Theory and Applications Research Collaboration Network, which provided the framework to continue collaborating and to produce this volume.This book contains six chapters, each of them on one of the different areas of research at the Workshop for Women in Graph Theory and Applications, and written by participants of each team.
Research Trends in Mathematics Teacher Education
by Jane-Jane Lo Keith R. Leatham Laura R. Van ZoestResearch on the preparation and continued development of mathematics teachers is becoming an increasingly important subset of mathematics education research. Such research explores the attributes, knowledge, skills and beliefs of mathematics teachers as well as methods for assessing and developing these critical aspects of teachers and influences on teaching. Research Trends in Mathematics Teacher Education focuses on three major themes in current mathematics teacher education research: mathematical knowledge for teaching, teacher beliefs and identities, and tools and techniques to support teacher learning. Through careful reports of individual research studies and cross-study syntheses of the state of research in these areas, the book provides insights into teachers' learning processes and how these processes can be harnessed to develop effective teachers. Chapters investigate bedrock skills needed for working with primary and secondary learners (writing relevant problems, planning lessons, being attentive to student learning) and illustrate how knowledge can be accessed, assessed, and nurtured over the course of a teaching career. Commentaries provide context for current research while identifying areas deserving future study. Included among the topics: Teachers' curricular knowledge Teachers' personal and classroom mathematics Teachers' learning journeys toward reasoning and sense-making Teachers' transitions in noticing Teachers' uses of a learning trajectory as a tool for mathematics lesson planning A unique and timely set of perspectives on the professional development of mathematics teachers at all stages of their careers, Research Trends in Mathematics Teacher Education brings clarity and practical advice to researchers as well as practitioners in this increasingly critical arena
A Researcher's Guide to Using Electronic Health Records: From Planning to Presentation
by Neal D. GoldsteinIn an age when electronic health records (EHRs) are an increasingly important source of data, this essential textbook provides both practical and theoretical guidance to researchers conducting epidemiological or clinical analysis through EHRs. Split into three parts, the book covers the research journey from start to finish. Part 1 focuses on the challenges inherent when working with EHRs, from access to data management, and raising issues such as completeness and accuracy which impact the validity of any research project. Part 2 examines the core research process itself, with chapters on research design, sampling, and analysis, as well as emerging methodological techniques. Part 3 demonstrates how EHR research can be made meaningful, from presentation to publication, and includes how findings can be applied to real-world issues of public health. Supported by case studies throughout, and applicable across a range of research software programs (including R, SPSS, and SAS), this is the ideal text for students and researchers engaging with EHRs across epidemiological and clinical research.
Researching International Migration: Lessons from the Kerala Experience
by K. C. Zachariah S. Irudaya RajanInternational migration and workers’ remittances have, of late, become a significant economic and social phenomena affecting the fortunes of millions of families in the developing countries of Asia, Africa and Latin America. Yet, the measurements and methods of analysis of their impact on the individuals, families, economy, and society have not received the attention they deserve. A first-of-its-kind study of international migration, based on large-scale surveys across a span of 15 years of fieldwork, this book: includes methods of conducting field surveys, estimating migration, and analysing migration trends, remittances, selectivity, and differentials; assesses other demographic, socio-economic phenomenon, such as education, employment and women’s status; provides a methodology to evaluate remittances and their influence on the economy; and examines social costs of migration on those left behind — parents, wives and children — a neglected area in the field of migration. This handbook will be invaluable to scholars and students of migration studies, demography, development studies and sociology as well as policy-makers, administrators, academics, and non-governmental organisations in the field.
Researching Mathematical Modelling Education in Disruptive Times (International Perspectives on the Teaching and Learning of Mathematical Modelling)
by Gabriele Kaiser Hans-Stefan Siller Vince GeigerThis edited volume documents research on mathematical modelling education, before, during, and after the Covid 19 pandemic. Mathematical modelling is essential for understanding natural and human generated phenomena, and informs decision-making about events such as the pandemic, climate change, and other disruptive events. Communication to the public, often by the media, makes use of mathematical modelling to justify changes to public policy, as seen during the COVID-19 crisis. Consequently, mathematical modelling has assumed an increasingly prominent role in curricula internationally, providing opportunities to understand how it is used in current circumstances and to plan for the needs of future societies. This book focuses on research on mathematical modelling education and its implementation at school and tertiary level. Contributions to the book and point to directions for further innovation in mathematical modelling education. Authors of this volume are members of the International Community of Teachers of Mathematical Modelling, the peak research body for the teaching and learning of mathematical modelling.
Reservoir Computing: Theory, Physical Implementations, and Applications (Natural Computing Series)
by Kohei Nakajima Ingo FischerThis book is the first comprehensive book about reservoir computing (RC). RC is a powerful and broadly applicable computational framework based on recurrent neural networks. Its advantages lie in small training data set requirements, fast training, inherent memory and high flexibility for various hardware implementations. It originated from computational neuroscience and machine learning but has, in recent years, spread dramatically, and has been introduced into a wide variety of fields, including complex systems science, physics, material science, biological science, quantum machine learning, optical communication systems, and robotics. Reviewing the current state of the art and providing a concise guide to the field, this book introduces readers to its basic concepts, theory, techniques, physical implementations and applications.The book is sub-structured into two major parts: theory and physical implementations. Both parts consist of a compilation of chapters, authored by leading experts in their respective fields. The first part is devoted to theoretical developments of RC, extending the framework from the conventional recurrent neural network context to a more general dynamical systems context. With this broadened perspective, RC is not restricted to the area of machine learning but is being connected to a much wider class of systems. The second part of the book focuses on the utilization of physical dynamical systems as reservoirs, a framework referred to as physical reservoir computing. A variety of physical systems and substrates have already been suggested and used for the implementation of reservoir computing. Among these physical systems which cover a wide range of spatial and temporal scales, are mechanical and optical systems, nanomaterials, spintronics, and quantum many body systems. This book offers a valuable resource for researchers (Ph.D. students and experts alike) and practitioners working in the field of machine learning, artificial intelligence, robotics, neuromorphic computing, complex systems, and physics.
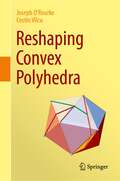
Reshaping Convex Polyhedra
by Costin Vîlcu Joseph O'Rourke^ the="" study="" of="" convex="" polyhedra="" in="" ordinary="" space="" is="" a="" central="" piece="" classical="" and="" modern="" geometry="" that="" has="" had="" significant="" impact="" on="" many="" areas="" mathematics="" also="" computer="" science.="" present="" book="" project="" by="" joseph="" o’rourke="" costin="" vîlcu="" brings="" together="" two="" important="" strands="" subject="" —="" combinatorics="" polyhedra,="" intrinsic="" underlying="" surface.="" this="" leads="" to="" remarkable="" interplay="" concepts="" come="" life="" wide="" range="" very="" attractive="" topics="" concerning="" polyhedra.="" gets="" message="" across="" thetheory="" although="" with="" roots,="" still="" much="" alive="" today="" continues="" be="" inspiration="" basis="" lot="" current="" research="" activity.="" work="" presented="" manuscript="" interesting="" applications="" discrete="" computational="" geometry,="" as="" well="" other="" mathematics.="" treated="" detail="" include="" unfolding="" onto="" surfaces,="" continuous="" flattening="" convexity="" theory="" minimal="" length="" enclosing="" polygons.="" along="" way,="" open="" problems="" suitable="" for="" graduate="" students="" are="" raised,="" both="" aThe focus of this monograph is converting—reshaping—one 3D convex polyhedron to another via an operation the authors call “tailoring.” A convex polyhedron is a gem-like shape composed of flat facets, the focus of study since Plato and Euclid. The tailoring operation snips off a corner (a “vertex”) of a polyhedron and sutures closed the hole. This is akin to Johannes Kepler’s “vertex truncation,” but differs in that the hole left by a truncated vertex is filled with new surface, whereas tailoring zips the hole closed. A powerful “gluing” theorem of A.D. Alexandrov from 1950 guarantees that, after closing the hole, the result is a new convex polyhedron. Given two convex polyhedra P, and Q inside P, repeated tailoringallows P to be reshaped to Q. Rescaling any Q to fit inside P, the result is universal: any P can be reshaped to any Q. This is one of the main theorems in Part I, with unexpected theoretical consequences.Part II carries out a systematic study of “vertex-merging,” a technique that can be viewed as a type of inverse operation to tailoring. Here the start is P which is gradually enlarged as much as possible, by inserting new surface along slits. In a sense, repeated vertex-merging reshapes P to be closer to planarity. One endpoint of such a process leads to P being cut up and “pasted” inside a cylinder. Then rolling the cylinder on a plane achieves an unfolding of P. The underlying subtext is a question posed by Geoffrey Shephard in 1975 and already implied by drawings by Albrecht Dürer in the 15th century: whether every convex polyhedron can be unfolded to a planar “net.” Toward this end, the authors initiate an exploration of convexity on convex polyhedra, a topic rarely studiedin the literature but with considerable promise for future development.This monograph uncovers new research directions and reveals connections among several, apparently distant, topics in geometry: Alexandrov’s Gluing Theorem, shortest paths and cut loci, Cauchy’s Arm Lemma, domes, quasigeodesics, convexity, and algorithms throughout. The interplay between these topics and the way the main ideas develop throughout the book could make the “journey” worthwhile for students and researchers in geometry, even if not directly interested in specific topics. Parts of the material will be of interest and accessible even to undergraduates. Although the proof difficulty varies from simple to quite intricate, with some proofs spanning several chapters, many examples and 125 figures help ease the exposition and illustrate the concepts.^>
Reshaping Power Dynamics Between Sustainable Growth and Technical Disruption: 6th International Conference on Economics and Social Sciences, ICESS 2023, Bucharest, Romania (Springer Proceedings in Business and Economics)
by Alina Mihaela Dima Sorin VâlceaThis book covers various topics related to economics and the social sciences, such as artificial intelligence, sustainability, ESG, and tax administration. The respective contributions provide insights and perspectives on the current challenges and opportunities in these fields, while also showcasing the latest research and innovations from scholars and practitioners around the world. The book is based on the papers presented at the 6th International Conference on Economics and Social Sciences, ICESS 2023, which was held in Bucharest, Romania.
Reshetnyak's Theory of Subharmonic Metrics
by François Fillastre Dmitriy SlutskiyDespite the fundamental role played by Reshetnyak's work in the theory of surfaces of bounded integral curvature, the proofs of his results were only available in his original articles, written in Russian and often hard to find. This situation used to be a serious problem for experts in the field. This book provides English translations of the full set of Reshetnyak's articles on the subject. Together with the companion articles, this book provides an accessible and comprehensive reference for the subject. In turn, this book should concern any researcher (confirmed or not) interested in, or active in, the field of bounded integral curvature surfaces, or more generally interested in surface geometry and geometric analysis. Due to the analytic nature of Reshetnyak's approach, it appears that his articles are very accessible for a modern audience, comparing to the works using a more synthetic approach. These articles of Reshetnyak concern more precisely the work carried by the author following the completion of his PhD thesis, under the supervision of A.D. Alexandrov. Over the period from the 1940’s to the 1960’s, the Leningrad School of Geometry, developed a theory of the metric geometry of surfaces, similar to the classical theory of Riemannian surfaces, but with lower regularity, allowing greater flexibility. Let us mention A.D. Alexandrov, Y.D. Burago and V.A. Zalgaller. The types of surfaces studied by this school are now known as surfaces of bounded curvature. Particular cases are that of surfaces with curvature bounded from above or below, the study of which gained special attention after the works of M. Gromov and G. Perelman. Nowadays, these concepts have been generalized to higher dimensions, to graphs, and so on, and the study of metrics of weak regularity remains an active and challenging field. Reshetnyak developed an alternative and analytic approach to surfaces of bounded integral curvature. The underlying idea is based on the theorem of Gauss which states that every Riemannian surface is locally conformal to Euclidean space. Reshetnyak thus studied generalized metrics which are locally conformal to the Euclidean metric with conformal factor given by the logarithm of the difference between two subharmonic functions on the plane. Reshetnyak's condition appears to provide the correct regularity required to generalize classical concepts such as measure of curvature, integral geodesic curvature for curves, and so on, and in turn, to recover surfaces of bounded curvature. Chapter-No.7, Chapter-No.8, Chapter-No.12 and Chapter-No.13 are available open access under Creative Commons Attribution-NonCommercial 4.0 International License via link.springer.com.
Residual Life Prediction and Optimal Maintenance Decision for a Piece of Equipment
by Changhua Hu Hongdong Fan Zhaoqiang WangThis book addresses remaining life prediction and predictive maintenance of equipment. It systematically summarizes the key research findings made by the author and his team and focuses on how to create equipment performance degradation and residual life prediction models based on the performance monitoring data produced by currently used and historical equipment. Some of the theoretical results covered here have been used to make remaining life predictions and maintenance-related decisions for aerospace products such as gyros and platforms. Given its scope, the book offers a valuable reference guide for those pursuing theoretical or applied research in the areas of fault diagnosis and fault-tolerant control, remaining life prediction, and maintenance decision-making.
Residual Stress, Thermomechanics & Infrared Imaging, Hybrid Techniques and Inverse Problems, Volume 7: Proceedings of the 2018 Annual Conference on Experimental and Applied Mechanics (Conference Proceedings of the Society for Experimental Mechanics Series)
by Antonio Baldi Simon Quinn Xavier Balandraud Janice M. Dulieu-Barton Sven BossuytResidual Stress, Thermomechanics & Infrared Imaging, Hybrid Techniques and Inverse Problems, Volume 7 of the Proceedings of the 2018 SEM Annual Conference & Exposition on Experimental and Applied Mechanics, the seventh volume of eight from the Conference, brings together contributions to this important area of research and engineering. The collection presents early findings and case studies on a wide range of areas, including: Inverse Problems/Hybrid TechniquesMaterial Characterizations Using ThermographyThermoelastic Stress AnalysisFatigue & Damage Evaluation Using Infrared ThermographyIntegration of Infrared Thermography & DICThermographic Non-Destructive Evaluation (NDE)
Residue Number Systems
by P. V. Ananda MohanThis new and expanded monograph improves upon Mohan's earlier book, Residue Number Systems (Springer, 2002) with a state of the art treatment of the subject. Replete with detailed illustrations and helpful examples, this book covers a host of cutting edge topics such as the core function, the quotient function, new Chinese Remainder theorems, and large integer operations. It also features many significant applications to practical communication systems and cryptography such as FIR filters and elliptic curve cryptography. Starting with a comprehensive introduction to the basics and leading up to current research trends that are not yet widely distributed in other publications, this book will be of interest to both researchers and students alike.
Resilience and Stability of Ecological and Social Systems
by István Karsai Thomas Schmickl George KampisThis monograph, co-authored by three longtime collaborators, aims to promote the interdisciplinary field of mathematical biology by providing accessible new approaches to study natural systems. As there is currently scarce literature on the applications of mathematical modelling for biology research, this book presents a new way of studying interactions at the level of populations, societies, ecosystems, and biomes through open-sourced modeling platforms. It offers an interdisciplinary approach to analyzing natural phenomena—for example, by showing how master equations developed to describe electrical circuits can also describe biological systems mathematically. Ultimately it promotes a method of study based on modelling and mathematical principles, facilitating collaboration between mathematicians, biologists, engineers, and other researchers to enrich knowledge of the world’s ecosystems.
