- Table View
- List View
Think Complexity: Complexity Science and Computational Modeling (Oreilly And Associate Ser.)
by Allen DowneyComplexity science uses computation to explore the physical and social sciences. In Think Complexity, you’ll use graphs, cellular automata, and agent-based models to study topics in physics, biology, and economics.Whether you’re an intermediate-level Python programmer or a student of computational modeling, you’ll delve into examples of complex systems through a series of worked examples, exercises, case studies, and easy-to-understand explanations.In this updated second edition, you will:Work with NumPy arrays and SciPy methods, including basic signal processing and Fast Fourier TransformStudy abstract models of complex physical systems, including power laws, fractals and pink noise, and Turing machinesGet Jupyter notebooks filled with starter code and solutions to help you re-implement and extend original experiments in complexity; and models of computation like Turmites, Turing machines, and cellular automataExplore the philosophy of science, including the nature of scientific laws, theory choice, and realism and instrumentalismIdeal as a text for a course on computational modeling in Python, Think Complexity also helps self-learners gain valuable experience with topics and ideas they might not encounter otherwise.
Think DSP: Digital Signal Processing in Python
by Allen B. DowneyIf you understand basic mathematics and know how to program with Python, you’re ready to dive into signal processing. While most resources start with theory to teach this complex subject, this practical book introduces techniques by showing you how they’re applied in the real world. In the first chapter alone, you’ll be able to decompose a sound into its harmonics, modify the harmonics, and generate new sounds.Author Allen Downey explains techniques such as spectral decomposition, filtering, convolution, and the Fast Fourier Transform. This book also provides exercises and code examples to help you understand the material.You’ll explore:Periodic signals and their spectrumsHarmonic structure of simple waveformsChirps and other sounds whose spectrum changes over timeNoise signals and natural sources of noiseThe autocorrelation function for estimating pitchThe discrete cosine transform (DCT) for compressionThe Fast Fourier Transform for spectral analysisRelating operations in time to filters in the frequency domainLinear time-invariant (LTI) system theoryAmplitude modulation (AM) used in radioOther books in this series include Think Stats and Think Bayes, also by Allen Downey.

Think Positive, Pippa! (Math Matters)
by Catherine DalyDiscover Math Matters! With over 15 million books sold worldwide, this award-winning series of easy-to-read books will help young readers ages 5-8 approach math with enthusiasm. Great for fans of MathStart or Step into Reading Math.A day at a Renaissance fair? Pippa isn&’t so sure. First she gets stuck with the jester costume, then the fair runs out of turkey legs. But after she becomes a game piece in a living board game, positive and negative take on all new meanings. Steps forward could take her to Unicorn Falls. Steps backward to Stinky Swamp. Think positive, Pippa! With engaging stories that connect math to kids&’ everyday lives, each book in the Teachers&’ Choice Award-winning Math Matters series focuses on a single concept and reinforces math vocabulary and skills. Bonus activities in the back of each book feature math and reading comprehension questions, and even more free activities online add to the fun! (Math topic: Positive and negative numbers).
Think Stats
by Allen B. DowneyIf you know how to program, you have the skills to turn data into knowledge. This thoroughly revised edition presents statistical concepts computationally, rather than mathematically, using programs written in Python. Through practical examples and exercises based on real-world datasets, you'll learn the entire process of exploratory data analysis—from wrangling data and generating statistics to identifying patterns and testing hypotheses. Whether you're a data scientist, software engineer, or data enthusiast, you'll get up to speed on commonly used tools including NumPy, SciPy, and Pandas. You'll explore distributions, relationships between variables, visualization, and many other concepts. And all chapters are available as Jupyter notebooks, so you can read the text, run the code, and work on exercises all in one place. Analyze data distributions and visualize patterns using Python librariesImprove predictions and insights with regression modelsDive into specialized topics like time series analysis and survival analysisIntegrate statistical techniques and tools for validation, inference, and moreCommunicate findings with effective data visualizationTroubleshoot common data analysis challengesBoost reproducibility and collaboration in data analysis projects with interactive notebooks
Think Twice
by Michael J. MauboussinNo matter your field, industry, or specialty, as a leader you make a series of crucial decisions every single day. And the harsh truth is that the majority of decisions--no matter how good the intentions behind them--are mismanaged, resulting in a huge toll on organizations, the people they employ, and even the people they serve.So why is it so hard to make sound decisions? In Think Twice, now in paperback, Michael Mauboussin argues that we often fall victim to simplified mental routines that prevent us from coping with the complex realities inherent in important judgment calls. Yet these cognitive errors are preventable.In this engaging book, Mauboussin shows us how to recognize and avoid common mental missteps. These include misunderstanding cause-and-effect linkages, not considering enough alternative possibilities in making a decision, and relying too much on experts.Through vivid stories, the author presents memorable rules for avoiding each error and explains how to recognize when you should "think twice"--questioning your reasoning and adopting decision-making strategies that are far more effective, even if they seem counterintuitive. Armed with this awareness, you'll soon begin making sounder judgment calls that benefit (rather than hurt) your organization.
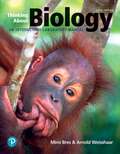
Thinking About Biology: An Introductory Lab Manual
by Mimi Bres Arnold WeisshaarThinking About Biology: An Introductory Lab Manual offers an extensively class-tested approach to the introductory biology laboratory course. The manual enables students to see how scientists work to solve problems through scientific investigation by asking questions and answering them through observations and conducting experiments. This lab manual helps students gain practical experience to better understand lecture concepts, acquire the basic knowledge needed to make informed decisions about biological questions in everyday life, develop the problem-solving skills that will lead to success in school and a competitive job market, and learn to work effectively and productively as a member of a team.
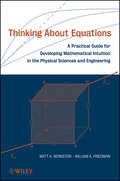
Thinking About Equations
by William A. Friedman Matt A. BernsteinAn accessible guide to developing intuition and skills for solving mathematical problems in the physical sciences and engineeringEquations play a central role in problem solving across various fields of study. Understanding what an equation means is an essential step toward forming an effective strategy to solve it, and it also lays the foundation for a more successful and fulfilling work experience. Thinking About Equations provides an accessible guide to developing an intuitive understanding of mathematical methods and, at the same time, presents a number of practical mathematical tools for successfully solving problems that arise in engineering and the physical sciences.Equations form the basis for nearly all numerical solutions, and the authors illustrate how a firm understanding of problem solving can lead to improved strategies for computational approaches. Eight succinct chapters provide thorough topical coverage, including:Approximation and estimationIsolating important variablesGeneralization and special casesDimensional analysis and scalingPictorial methods and graphical solutionsSymmetry to simplify equationsEach chapter contains a general discussion that is integrated with worked-out problems from various fields of study, including physics, engineering, applied mathematics, and physical chemistry. These examples illustrate the mathematical concepts and techniques that are frequently encountered when solving problems. To accelerate learning, the worked example problems are grouped by the equation-related concepts that they illustrate as opposed to subfields within science and mathematics, as in conventional treatments. In addition, each problem is accompanied by a comprehensive solution, explanation, and commentary, and numerous exercises at the end of each chapter provide an opportunity to test comprehension.Requiring only a working knowledge of basic calculus and introductory physics, Thinking About Equations is an excellent supplement for courses in engineering and the physical sciences at the upper-undergraduate and graduate levels. It is also a valuable reference for researchers, practitioners, and educators in all branches of engineering, physics, chemistry, biophysics, and other related fields who encounter mathematical problems in their day-to-day work.
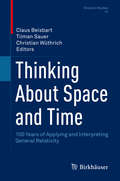
Thinking About Space and Time: 100 Years of Applying and Interpreting General Relativity (Einstein Studies #15)
by Tilman Sauer Claus Beisbart Christian WüthrichThis volume offers an integrated understanding of how the theory of general relativity gained momentum after Einstein had formulated it in 1915. Chapters focus on the early reception of the theory in physics and philosophy and on the systematic questions that emerged shortly after Einstein's momentous discovery. They are written by physicists, historians of science, and philosophers, and were originally presented at the conference titled Thinking About Space and Time: 100 Years of Applying and Interpreting General Relativity, held at the University of Bern from September 12-14, 2017. By establishing the historical context first, and then moving into more philosophical chapters, this volume will provide readers with a more complete understanding of early applications of general relativity (e.g., to cosmology) and of related philosophical issues. Because the chapters are often cross-disciplinary, they cover a wide variety of topics related to the general theory of relativity. These include:Heuristics used in the discovery of general relativityMach's PrincipleThe structure of Einstein's theoryCosmology and the Einstein worldStability of cosmological modelsThe metaphysical nature of spacetimeThe relationship between spacetime and dynamicsThe Geodesic PrincipleSymmetriesThinking About Space and Time will be a valuable resource for historians of science and philosophers who seek a deeper knowledge of the (early and later) uses of general relativity, as well as for physicists and mathematicians interested in exploring the wider historical and philosophical context of Einstein's theory.
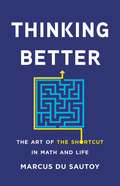
Thinking Better: The Art of the Shortcut in Math and Life
by Marcus du SautoyOne of the world's great mathematicians shows why math is the ultimate timesaver—and how everyone can make their lives easier with a few simple shortcuts.We are often told that hard work is the key to success. But success isn&’t about hard work – it&’s about shortcuts. Shortcuts allow us to solve one problem quickly so that we can tackle an even bigger one. They make us capable of doing great things. And according to Marcus du Sautoy, math is the very art of the shortcut.Thinking Better is a celebration of how math lets us do more with less. Du Sautoy explores how diagramming revolutionized therapy, why calculus is the greatest shortcut ever invented, whether you must really practice for ten thousand hours to become a concert violinist, and why shortcuts give us an advantage over even the most powerful AI. Throughout, we meet artists, scientists, and entrepreneurs who use mathematical shortcuts to change the world.Delightful, illuminating, and above all practical, Thinking Better is for anyone who has wondered why you should waste time climbing the mountain when you could go around it much faster.
Thinking Deeply About Primary Mathematics
by Kieran MackleThinking Deeply about Primary Mathematics is a comprehensive exploration of the ideas, theories and practices of most value to beginning teachers, as well as any teacher with the desire to improve their practice.Immediately applicable in the classroom and supported by robust analysis of research into mathematics teaching, this book is designed to provide inspiration for specialised teaching assignments with the power to enhance both the rate and quality of your professional development journey.Through the use of expertly crafted explanations, examples and tasks, each chapter will guide you step by step through the otherwise intimidating world of primary mathematics teaching.This book is perfect for teachers driven to become highly effective practitioners. It also serves as a blueprint for school leaders looking to develop the abilities of their teachers and ensure the highest quality mathematics education for all children.Teacher proficiency is a vast uneven continuum but in taking time to think deeply about primary mathematics we allow ourselves with the opportunity to build a solid base from which a successful, fulfilling career can be constructed.The insight and expertise provided by Thinking Deeply About Primary Mathematics is essential for anyone involved in the teaching of mathematics.
Thinking Geometrically: A Survey of Geometries (Maa Textbooks #26)
by Thomas Q. SibleyThis is a well written and comprehensive survey of college geometry that would serve a wide variety of courses for both mathematics majors and mathematics education majors. Great care and attention is spent on developing visual insights and geometric intuition while stressing the logical structure, historical development, and deep interconnectedness of the ideas. <P><P>Students with less mathematical preparation than upper-division mathematics majors can successfully study the topics needed for the preparation of high school teachers. There is a multitude of exercises and projects in those chapters developing all aspects of geometric thinking for these students as well as for more advanced students. These chapters include Euclidean Geometry, Axiomatic Systems and Models, Analytic Geometry, Transformational Geometry, and Symmetry. Topics in the other chapters, including Non-Euclidean Geometry, Projective Geometry, Finite Geometry, Differential Geometry, and Discrete Geometry, provide a broader view of geometry. The different chapters are as independent as possible, while the text still manages to highlight the many connections between topics. <P><P>The text is self-contained, including appendices with the material in Euclid s first book and a high school axiomatic system as well as Hilbert s axioms. Appendices give brief summaries of the parts of linear algebra and multivariable calculus needed for certain chapters. While some chapters use the language of groups, no prior experience with abstract algebra is presumed. The text will support an approach emphasizing dynamical geometry software without being tied to any particular software.
Thinking In Numbers: On Life, Love, Meaning, and Math
by Daniel Tammet"Englarges one's wonder at Tammet's mind and his all-embracing vision of the world as grounded in numbers." --Oliver Sacks, MD THINKING IN NUMBERS is the book that Daniel Tammet, bestselling author and mathematical savant, was born to write. In Tammet's world, numbers are beautiful and mathematics illuminates our lives and minds. Using anecdotes, everyday examples, and ruminations on history, literature, and more, Tammet allows us to share his unique insights and delight in the way numbers, fractions, and equations underpin all our lives. Inspired by the complexity of snowflakes, Anne Boleyn's eleven fingers, or his many siblings, Tammet explores questions such as why time seems to speed up as we age, whether there is such a thing as an average person, and how we can make sense of those we love. THINKING IN NUMBERS will change the way you think about math and fire your imagination to see the world with fresh eyes.
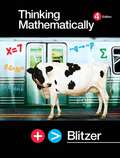
Thinking Mathematically
by Robert BlitzerIn Thinking Mathematically, Sixth Edition, Bob Blitzer's distinctive and relatable voice motivates students from diverse backgrounds and majors, engaging them in the math through compelling, real-world applications. Understanding that most students in a liberal arts math course are not math majors, and are unlikely to take another math class, Blitzer has provided tools in every chapter to help them master the material with confidence, while also showing them the beauty and fun of math. The variety of topics and flexibility of sequence make this text appropriate for a one- or two-term course in liberal arts mathematics or general education mathematics.
Thinking Mathematically
by Robert BlitzerThis general survey of mathematical topics helps a diverse audience, with different backgrounds and career plans, to understand mathematics. Blitzer provides the applications and technology readers need to gain an appreciation of mathematics in everyday life.
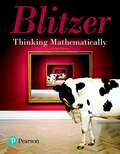
Thinking Mathematically
by Robert BlitzerStudents often struggle to find the relevance of math in their everyday lives. In Thinking Mathematically, 7th Edition, Bob Blitzer’s distinctive and relatable voice engages students in the world of math through compelling, real-world applications ― student-loan debt, time breakdown for an average NFL broadcast, and many more.

Thinking Probabilistically: Stochastic Processes, Disordered Systems, and Their Applications
by Ariel AmirProbability theory has diverse applications in a plethora of fields, including physics, engineering, computer science, chemistry, biology and economics. This book will familiarize students with various applications of probability theory, stochastic modeling and random processes, using examples from all these disciplines and more. The reader learns via case studies and begins to recognize the sort of problems that are best tackled probabilistically. The emphasis is on conceptual understanding, the development of intuition and gaining insight, keeping technicalities to a minimum. Nevertheless, a glimpse into the depth of the topics is provided, preparing students for more specialized texts while assuming only an undergraduate-level background in mathematics. The wide range of areas covered - never before discussed together in a unified fashion – includes Markov processes and random walks, Langevin and Fokker–Planck equations, noise, generalized central limit theorem and extreme values statistics, random matrix theory and percolation theory.
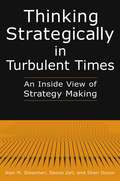
Thinking Strategically in Turbulent Times: An Inside View of Strategy Making
by Alan M. Glassman Deonne Zell Shari DuronAn emergent approach to organizational strategy making assumptions that few organizations actually realize the goal of deliberative, top-down strategic planning, and that effective strategy making occurs on a continual basis and is a shared activity of the entire organization. This innovative book provides the first in-depth look at how real organizations are formulating and implementing strategic change under this new paradigm. The authors have dug deep into three large and varied organizations (Hewlett-Packard, the California State University system, and the County of Los Angeles) and identified each one's efforts to develop a new strategic planning process better-suited to match the current pace of change and environmental unpredictability. The book is filled with vignettes, quotes, and real-world examples that illustrate the trend toward faster, more adaptive strategic planning processes. It is relevant for a wide range of business, governmental, and non-profit settings, and should be required reading in any course on strategic planning.
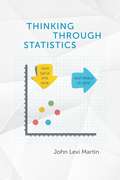
Thinking Through Statistics
by John Levi MartinSimply put, Thinking Through Statistics is a primer on how to maintain rigorous data standards in social science work, and one that makes a strong case for revising the way that we try to use statistics to support our theories. But don’t let that daunt you. With clever examples and witty takeaways, John Levi Martin proves himself to be a most affable tour guide through these scholarly waters. Martin argues that the task of social statistics isn't to estimate parameters, but to reject false theory. He illustrates common pitfalls that can keep researchers from doing just that using a combination of visualizations, re-analyses, and simulations. Thinking Through Statistics gives social science practitioners accessible insight into troves of wisdom that would normally have to be earned through arduous trial and error, and it does so with a lighthearted approach that ensures this field guide is anything but stodgy.
Thinking With Mathematical Models, Linear and Inverse Variation
by Glenda Lappan James T. Fey William M. Fitzgerald Susan N. Friel Elizabeth Difanis PhillipsNIMAC-sourced textbook
Thinking With Mathematical Models: Linear and Inverse Variation (Texas)
by Glenda Lappan James T. Fey William M. Fitzgerald Susan N. Friel Elizabeth Difanis PhillipsNIMAC-sourced textbook
Thinking and Reasoning with Data and Chance Sixty-eighth Yearbook
by Portia C. Elliott Gail F. BurrillThe 2006 NCTM Sixty-eighth Yearbook focuses on students' and teachers' learning in statistics centered on a set of activities. Topics include the relation between mathematics and statistics, the development and enrichment of mathematical concepts through the use of statistics, and a discussion of the research related to teaching and learning statistics. The yearbook articles cover a variety of broad areas, including sections on Learning about Data and Chance, Reasoning with Data and Chance, and Reflecting on Issues Related to Data and Chance. Articles focus on such topics as examining children's beliefs about what is fair and using simulation techniques in the classroom. NCTM yearbooks focus concerted attention on timely issues by viewing them in depth, from multiple perspectives, through interdisciplinary lenses, and across different grade bands. The year 2006 marks the sixty-eighth yearbook in the NCTM yearbook series.
Thinking in Numbers: How Maths Illuminates Our Lives
by Daniel TammetThis is the book that Daniel Tammet, bestselling author and mathematical savant, was born to write. In Tammet's world, numbers are beautiful and mathematics illuminates our lives and minds. Using anecdotes and everyday examples, Tammet allows us to share his unique insights and delight in the way numbers, fractions and equations underpin all our lives.Inspired by the complexity of snowflakes, Anne Boleyn's sixth finger or his mother's unpredictable behaviour, Tammet explores questions such as why time seems to speed up as we age, whether there is such a thing as an average person and how we can make sense of those we love.Thinking in Numbers will change the way you think about maths and fire your imagination to see the world with fresh eyes.
Thinking in Numbers: How Maths Illuminates Our Lives
by Daniel TammetThis is the book that Daniel Tammet, bestselling author and mathematical savant, was born to write. In Tammet's world, numbers are beautiful and mathematics illuminates our lives and minds. Using anecdotes and everyday examples, Tammet allows us to share his unique insights and delight in the way numbers, fractions and equations underpin all our lives.Inspired by the complexity of snowflakes, Anne Boleyn's sixth finger or his mother's unpredictable behaviour, Tammet explores questions such as why time seems to speed up as we age, whether there is such a thing as an average person and how we can make sense of those we love.Thinking in Numbers will change the way you think about maths and fire your imagination to see the world with fresh eyes.(P)2013 Hodder & Stoughton
Thinking in Problems
by Alexander A. RoytvarfThis concise, self-contained textbook gives an in-depth look at problem-solving from a mathematician's point-of-view. Each chapter builds off the previous one, while introducing a variety of methods that could be used when approaching any given problem. Creative thinking is the key to solving mathematical problems, and this book outlines the tools necessary to improve the reader's technique. The text is divided into twelve chapters, each providing corresponding hints, explanations, and finalization of solutions for the problems in the given chapter. For the reader's convenience, each exercise is marked with the required background level. This book implements a variety of strategies that can be used to solve mathematical problems in fields such as analysis, calculus, linear and multilinear algebra and combinatorics. It includes applications to mathematical physics, geometry, and other branches of mathematics. Also provided within the text are real-life problems in engineering and technology. Thinking in Problems is intended for advanced undergraduate and graduate students in the classroom or as a self-study guide. Prerequisites include linear algebra and analysis.