- Table View
- List View
Tubular String Characterization in High Temperature High Pressure Oil and Gas Wells (Multiphysics Modeling)
by Jiuping Xu Zezhong WuHigh temperature, high oil pressure, oil and gas well completion testing have always been a technical challenge and basic theoretical research is one of the key factors needed to ensure a successful completion test. The completion test basic theory includes: a stress analysis of the completion string, completion string buckling behavior, and temperature and pressure distribution prediction. The completion string is the main bearing and power transmission component for oil and gas well operations and production, and it is required to take on a combination of loads, which result in completion string deformation. Because of these complex relationships, completion string stress analysis has become increasingly more complicated.This book discusses the characters of tubular strings in HTHP (High Temperature - High Pressure) oil and gas wells. These characters include the mechanical behavior of tubular strings and the temperature and pressure variation of tubular strings in different conditions. Mathematical models are established for different conditions and solution existence and uniqueness of some models is discussed, providing algorithms corresponding to the different models. Numerical experiments are presented to verify the validity of models and the feasibility of algorithms, and the impact of the parameters of models for oil and gas wells is also discussed.This book is written for production and testing engineers to provide them with the tools to deal more effectively with the numerical decisions they have to take and for researchers and technicians in petroleum and gas testing and production engineering. Finally, it is also intended to serve as a reference book for mathematicians, college teachers and students.
Tuning the Snowflake Data Cloud: Optimizing Your Data Platform to Minimize Cost and Maximize Performance
by Andrew CarruthersThis project-oriented book presents a hands-on approach to identifying migration and performance issues with experience drawn from real-world examples. As you work through the book, you will develop skills, knowledge, and deep understanding of Snowflake tuning options and capabilities while preparing for later incorporation of additional Snowflake features as they become available. Your Snowflake platform will cost less to run and will improve your customer experience. Written by a seasoned Snowflake practitioner, this book is full of practical, hands-on guidance and advice specifically designed to further accelerate your Snowflake journey. Tuning the Snowflake Data Cloud provides you a pathway to success by equipping you with the skills, knowledge, and expertise needed to elevate your Snowflake experience. The book shows you how to leverage what you already know, adds what you don’t, and helps you apply it toward delivering for your Snowflake accounts. Read this book to embark on a voyage of advancement and equip your organization to deliver consistent Snowflake performance. What You Will Learn Recognize and understand the root cause of performance bottlenecks Know how to resolve performance issues Develop a deep understanding of Snowflake performance tuning options Reduce expensive mistakes, remediate poorly performing code Manage Snowflake costs
Turbulence and Self-Organization
by Mikhail Ya Marov Aleksander V. KolesnichenkoThe book deals with the development of continual models of turbulent natural media. Such models serve as a ground for the statement and numerical evaluation of the key problems of the structure and evolution of the numerous astrophysical and geophysical objects. The processes of ordering (self-organization) in an originally chaotic turbulent medium are addressed and treated in detail with the use of irreversible thermodynamics and stochastic dynamics approaches which underlie the respective models. Different examples of ordering set up in the natural environment and outer space are brought and thoroughly discussed, the main focus being given to the protoplanetary discs formation and evolution.
Turing’s Revolution: The Impact of His Ideas about Computability
by Giovanni Sommaruga Thomas StrahmThis book provides an overview of the confluence of ideas in Turing’s era and work and examines the impact of his work on mathematical logic and theoretical computer science. It combines contributions by well-known scientists on the history and philosophy of computability theory as well as on generalised Turing computability. By looking at the roots and at the philosophical and technical influence of Turing’s work, it is possible to gather new perspectives and new research topics which might be considered as a continuation of Turing’s working ideas well into the 21st century.The Stored-Program Universal Computer: Did Zuse Anticipate Turing and von Neumann?” is available open access under a Creative Commons Attribution 4.0 International License via link.springer.com
Turn on The Human Calculator in You: The Human Calculator
by Scott FlansburgThis workbook, along with the separately-sold "Answer Guide," will introduce you to all the basic arithmetic facts using The Human Calculator Matrix. Discover all the patterns that will make you feel like a mathlete and a human calculator.
Turning Points in the History of Mathematics
by Hardy Grant Israel KleinerThis book explores some of the major turning points in the history of mathematics, ranging from ancient Greece to the present, demonstrating the drama that has often been a part of its evolution. Studying these breakthroughs, transitions, and revolutions, their stumbling-blocks and their triumphs, can help illuminate the importance of the history of mathematics for its teaching, learning, and appreciation. Some of the turning points considered are the rise of the axiomatic method (most famously in Euclid), and the subsequent major changes in it (for example, by David Hilbert); the "wedding," via analytic geometry, of algebra and geometry; the "taming" of the infinitely small and the infinitely lar≥ the passages from algebra to algebras, from geometry to geometries, and from arithmetic to arithmetics; and the revolutions in the late nineteenth and early twentieth centuries that resulted from Georg Cantor's creation of transfinite set theory. The origin of each turning point is discussed, along with the mathematicians involved and some of the mathematics that resulted. Problems and projects are included in each chapter to extend and increase understanding of the material. Substantial reference lists are also provided. Turning Points in the History of Mathematics will be a valuable resource for teachers of, and students in, courses in mathematics or its history. The book should also be of interest to anyone with a background in mathematics who wishes to learn more about the important moments in its development.
Turnpike Conditions in Infinite Dimensional Optimal Control (Springer Optimization and Its Applications #148)
by Alexander J. ZaslavskiThis book provides a comprehensive study of turnpike phenomenon arising in optimal control theory. The focus is on individual (non-generic) turnpike results which are both mathematically significant and have numerous applications in engineering and economic theory. All results obtained in the book are new. New approaches, techniques, and methods are rigorously presented and utilize research from finite-dimensional variational problems and discrete-time optimal control problems to find the necessary conditions for the turnpike phenomenon in infinite dimensional spaces. The semigroup approach is employed in the discussion as well as PDE descriptions of continuous-time dynamics. The main results on sufficient and necessary conditions for the turnpike property are completely proved and the numerous illustrative examples support the material for the broad spectrum of experts. Mathematicians interested in the calculus of variations, optimal control and in applied functional analysis will find this book a useful guide to the turnpike phenomenon in infinite dimensional spaces. Experts in economic and engineering modeling as well as graduate students will also benefit from the developed techniques and obtained results.
Turnpike Phenomenon and Infinite Horizon Optimal Control
by Alexander J. ZaslavskiThis book is devoted to the study of the turnpike phenomenon and describes the existence of solutions for a large variety of infinite horizon optimal control classes of problems. Chapter 1 provides introductory material on turnpike properties. Chapter 2 studies the turnpike phenomenon for discrete-time optimal control problems. The turnpike properties of autonomous problems with extended-value integrands are studied in Chapter 3. Chapter 4 focuses on large classes of infinite horizon optimal control problems without convexity (concavity) assumptions. In Chapter 5, the turnpike results for a class of dynamic discrete-time two-player zero-sum game are proven. This thorough exposition will be very useful for mathematicians working in the fields of optimal control, the calculus of variations, applied functional analysis and infinite horizon optimization. It may also be used as a primary text in a graduate course in optimal control or as supplementary text for a variety of courses in other disciplines. Researchers in other fields such as economics and game theory, where turnpike properties are well known, will also find this Work valuable.
Turnpike Phenomenon in Metric Spaces (Springer Optimization and Its Applications #201)
by Alexander J. ZaslavskiThis book is devoted to the study of the turnpike phenomenon arising in optimal control theory. Special focus is placed on Turnpike results, in sufficient and necessary conditions for the turnpike phenomenon and in its stability under small perturbations of objective functions. The most important feature of this book is that it develops a large, general class of optimal control problems in metric space. Additional value is in the provision of solutions to a number of difficult and interesting problems in optimal control theory in metric spaces. Mathematicians working in optimal control, optimization, and experts in applications of optimal control to economics and engineering, will find this book particularly useful.All main results obtained in the book are new. The monograph contains nine chapters. Chapter 1 is an introduction. Chapter 2 discusses Banach space valued functions, set-valued mappings in infinite dimensional spaces, and related continuous-time dynamical systems. Some convergence results are obtained. In Chapter 3, a discrete-time dynamical system with a Lyapunov function in a metric space induced by a set-valued mapping, is studied. Chapter 4 is devoted to the study of a class of continuous-time dynamical systems, an analog of the class of discrete-time dynamical systems considered in Chapter 3. Chapter 5 develops a turnpike theory for a class of general dynamical systems in a metric space with a Lyapunov function. Chapter 6 contains a study of the turnpike phenomenon for discrete-time nonautonomous problems on subintervals of half-axis in metric spaces, which are not necessarily compact. Chapter 7 contains preliminaries which are needed in order to study turnpike properties of infinite-dimensional optimal control problems. In Chapter 8, sufficient and necessary conditions for the turnpike phenomenon for continuous-time optimal control problems on subintervals of the half-axis in metric spaces, is established. In Chapter 9, the examination continues of the turnpike phenomenon for the continuous-time optimal control problems on subintervals of half-axis in metric spaces discussed in Chapter 8.
Turnpike Theory for the Robinson–Solow–Srinivasan Model (Springer Optimization and Its Applications #166)
by Alexander J. ZaslavskiThis book is devoted to the study of a class of optimal control problems arising in mathematical economics, related to the Robinson–Solow–Srinivasan (RSS) model. It will be useful for researches interested in the turnpike theory, infinite horizon optimal control and their applications, and mathematical economists. The RSS is a well-known model of economic dynamics that was introduced in the 1960s and as many other models of economic dynamics, the RSS model is determined by an objective function (a utility function) and a set-valued mapping (a technology map). The set-valued map generates a dynamical system whose trajectories are under consideration and the objective function determines an optimality criterion. The goal is to find optimal trajectories of the dynamical system, using the optimality criterion. Chapter 1 discusses turnpike properties for some classes of discrete time optimal control problems. Chapter 2 present the description of the RSS model and discuss its basic properties. Infinite horizon optimal control problems, related to the RSS model are studied in Chapter 3. Turnpike properties for the RSS model are analyzed in Chapter 4. Chapter 5 studies infinite horizon optimal control problems related to the RSS model with a nonconcave utility function. Chapter 6 focuses on infinite horizon optimal control problems with nonautonomous optimality criterions. Chapter 7 contains turnpike results for a class of discrete-time optimal control problems. Chapter 8 discusses the RSS model and compares different optimality criterions. Chapter 9 is devoted to the study of the turnpike properties for the RSS model. In Chapter 10 the one-dimensional autonomous RSS model is considered and the continuous time RSS model is studied in Chapter 11.
Turnpike Theory of Continuous-Time Linear Optimal Control Problems
by Alexander J. ZaslavskiIndividual turnpike results are of great interest due to their numerous applications in engineering and in economic theory; in this book the study is focused on new results of turnpike phenomenon in linear optimal control problems. The book is intended for engineers as well as for mathematicians interested in the calculus of variations, optimal control and in applied functional analysis. Two large classes of problems are studied in more depth. The first class studied in Chapter 2 consists of linear control problems with periodic nonsmooth convex integrands. Chapters 3-5 consist of linear control problems with autonomous convex smooth integrands. Chapter 6 discusses a turnpike property for dynamic zero-sum games with linear constraints. Chapter 7 examines genericity results. In Chapter 8, the description of structure of variational problems with extended-valued integrands is obtained. Chapter 9 ends the exposition with a study of turnpike phenomenon for dynamic games with extended value integrands.
Tutorium Algebra: Mathematik von Studenten für Studenten erklärt und kommentiert
by Martin Kreh Florian ModlerIn einer Algebra-Vorlesung beschäftigt man sich nicht mehr mit Linearer Algebra, sondern es wird abstrakter. Um die Studierenden beim Verständnis für diesen abstrakten Stoff zu unterstützen, erscheint nun mit "Tutorium Algebra" ein weiterer Band der Tutoriums-Reihe der Autoren Modler und Kreh.In dem Buch erläutern die beiden Autoren den Stoff der Algebra. Dabei liegt das Hauptaugenmerk auf der Körpertheorie, genauer der Galoistheorie. Die Inhalte werden an verständlichen und ausführlichen vorgerechneten Beispielen erklärt. Das Konzept bleibt wieder das bewährte: Jedes Kapitel ist zwei geteilt in einen mathematischen Teil, in dem die Definitionen, Sätze und Beweise stehen, und einen erklärenden Teil, in dem die schwierigen Definitionen und Sätze auf gewohnt lockere und lustige Art und Weise mit mehr als 120 Beispielen und etwa 30 Abbildungen mit Leben gefüllt werden.So erhält der Leser einerseits einen Blick für mathematisch exakte Formulierungen und andererseits Hilfen und Anschauungen, die wichtig sind, um den Stoff zu verstehen.Das Buch ist in der 3. Auflage vollständig durchgesehen, verbessert und ergänzt worden. Insbesondere finden sich im Kapitel über Ringe und Ideale einige neue Beispiele (z.B. über den Ring der holomorphen Funktionen) und die Lokalisierung von Ringen wird behandelt. Zudem wurden weitere Kriterien zur Irreduzibilität von Polynomen ergänzt.
Tutorium Analysis 1 und Lineare Algebra 1
by Martin Kreh Florian ModlerDieses Buch soll Ihnen als Mathematik-Erstsemester den Einstieg und Umstieg von der Schulmathematik in die Hochschulmathematik erleichtern und Ihnen somit helfen, viele der üblichen Erstsemester-Fehler zu vermeiden. Das Buch ist anders als alle anderen, denn es wurde von Studenten geschrieben, die Erfahrung als Tutor, Übungsleiter und Korrektoren haben. Dadurch wissen die Autoren zum einen, welche Themen schwer verständlich sind und besonders ausführlich behandelt werden müssen und zum anderen kennen sie häufige Fehler und können auf diese hinweisen. In dem Buch gibt es einen mathematischen Teil, den der Student für Prüfungen beherrschen muss. Bei Fragen oder Problemen kann er dann in dem kommentierten Teil nachschauen und dort ausführliche Erklärungen, Hilfen und Beispiele der Autoren finden.
Tutorium Analysis 1 und Lineare Algebra 1: Mathematik von Studenten für Studenten erklärt und kommentiert
by Martin Kreh Florian ModlerDieses Buch soll Ihnen als Mathematik-Erstsemester den Einstieg und Umstieg von der Schulmathematik in die Hochschulmathematik erleichtern und Ihnen somit helfen, viele der üblichen Erstsemester-Fehler zu vermeiden. Denn aller Anfang ist schwer und die Autoren wollen versuchen, Ihnen den Anfang so leicht wie möglich zu machen und Ihnen helfen, Schwierigkeiten zu überstehen, die im ersten Semester ganz normal sind. Das Buch ist anders als alle anderen, denn es wurde von Studenten geschrieben, die Erfahrung als Tutor, Übungsleiter und Korrektoren haben. Dadurch wissen die Autoren zum einen, welche Themen schwer verständlich sind und besonders ausführlich behandelt werden müssen und zum anderen kennen sie häufige Fehler und können auf diese hinweisen. In dem Buch gibt es einen mathematischen Teil, den der Student für Prüfungen beherrschen muss. Bei Fragen oder Problemen kann er dann in dem kommentierten Teil nachschauen und dort ausführliche Erklärungen, Hilfen und Beispiele der Autoren finden. So verfügt der Leser über zweierlei: Einerseits über die mathematisch exakte Definition oder den mathematisch präzisen Satz und Beweis und anderseits über Hilfen und Anschauungen, die ebenso wichtig sind, um den Stoff zu verstehen.Das Buch ist in der 4. Auflage um weitere Beispiele und zwei Beispielklausuren ergänzt worden. Stimmen zur 1. Auflage: „Es handelt sich also um ein sehr empfehlenswertes Buch für Einsteiger in das Studienfach Mathematik, welches sowohl umfangreich als auch verständlich gestaltet ist.“ Maik Messerschmidt auf www.uni-online.de„Super für den Studienbeginn! Kann dieses Buch nur jedem empfehlen, der im ersten Semester eine Vorlesung in Analysis oder Linearer Algebra hört! Habe schon einige Mathebücher durch und einige Sachen hatte ich trotzdem noch nicht richtig verstanden. Mit Hilfe dieses Buches jedoch wurden viele (komplizierte) Sachverhalte viel verständlicher.“ Kundenrezension auf www.amazon.de
Tutorium Analysis 1 und Lineare Algebra 1: Mathematik von Studierenden für Studierende erklärt und kommentiert
by Martin Kreh Florian Modler Maja BoldtDieses Buch erleichtert euch im ersten Semester des Mathematikstudiums den Einstieg und Umstieg von der Schulmathematik in die Hochschulmathematik. Die Autor*innen machen euch den Einstieg ins Mathestudium so leicht wie möglich: Sie helfen euch dabei, übliche Erstsemester-Fehler zu vermeiden und die Schwierigkeiten zu überstehen, die im ersten Semester ganz normal sind. Schwer verständliche Themen behandeln die Autor*innen besonders ausführlich, auf häufige Fehler weisen sie euch hin. Die essenziellen Inhalte des ersten Semesters werden hier in 21 einzelnen Kapiteln abgedeckt, die jeweils aus zwei sehr verschiedenen Teilen bestehen: Im jeweils ersten Teil findet ihr die mathematisch exakten Definitionen, Sätze und Beweise, die euch auch in euren Vorlesungen begegnen werden. Im jeweils zweiten Teil findet ihr sehr ausführliche und möglichst anschauliche Erklärungen, Hilfen und Beispiele. Bei Fragen und Verständnisproblemen könnt ihr in diesem kommentierten Teil nachschauen. Solltet ihr also irgendeine Definition in der Vorlesung nicht auf Anhieb verstehen, schlagt sie einfach hier nach. Außerdem steht jeweils eine Probeklausur zur Analysis und zur Linearen Algebra zur Verfügung, damit ihr euer erworbenes Wissen testen könnt. Natürlich gibt es dazu auch Musterlösungen. Für die 5. Auflage wurde das Buch nochmals überarbeitet und um gut 230 Flashcards ergänzt, die im Browser oder in der SN-Flashcards-App online abrufbar sind. Mit den Flashcards könnt ihr auch zwischendurch und unterwegs gut weiterlernen und die Inhalte verinnerlichen.
Tutorium Analysis 2 und Lineare Algebra 2: Mathematik von Studenten für Studenten erklärt und kommentiert
by Martin Kreh Florian ModlerNach dem großen Erfolg von "Tutorium Analysis 1 und Lineare Algebra 1" erscheint nun ein Fortsetzungsband der beiden Autoren, mit dem sie den Zweitsemestern und allen, die Analysis 2 und Lineare Algebra 2 oder verwandte Vorlesungen hören müssen, wieder unterstützend unter die Arme greifen.Das Konzept bleibt das Altbewährte: Es gibt wieder einen mathematischen Teil, in dem die Definitionen, Sätze und Beweise stehen, und einen erklärenden Teil, in dem die schwierigen Definitionen und Sätze auf gewohnte lockere und lustige Art und Weise mit vielen Beispielen und Abbildungen mit Leben gefüllt werden.Das Buch ist für die zweite Auflage vollständig durchgesehen und an etlichen Stellen geändert und weiter verbessert.
Tutorium Mathe für Biologen: Von Studenten für Studenten
by Lorenz Adlung Christian Hopp Alexandra Köthe Niko Schnellbächer Oskar StauferWarum ein Mathebuch für Biologen von Studenten für Studenten?Wir wissen, was man an Mathe für Bio wirklich für die Prüfungen und die Bachelorarbeit braucht. Wir haben selbst Bio oder Mathe/Physik studiert und hautnah erlebt, wie unglaublich beliebt Mathe für Biologen ist. Neben einer „natürlichen Abneigung“ liegt es oft daran, dass die Lehre selten anwendungsbezogen ist. Wir haben uns bemüht, in einem Buch nur das aufzuführen, was man als Biologe wirklich benötigt und alles andere konsequent wegzulassen. Es gibt ständig Bezüge zu Publikationen aus den modernen Biowissenschaften. Solche relevanten Beispiele werden euch bestimmt hilfreich sein. Und das Beste: Das Buch ist garantiert häschenfrei! Wir rechnen nicht mit Hasenpopulationen sondern aktuellen Beispielen wie z.B. Signalwegen. Inhaltlich deckt das Buch den Stoff der ersten Mathevorlesungen für Biologen an den meisten Unis ab. Falls ihr mehr wissen möchtet, findet ihr uns auch auf Facebook unter „häschenfreie Mathe“.
Tutorium Mathematik für Naturwissenschaften: Tipps, Tricks und viele Beispiele
by Hrvoje KrizicBist du in deinem ersten Studienjahr und suchst Klarheit in der komplexen Welt der Hochschulmathematik? Dieses Buch richtet sich an Studierende, die Mathematik nicht als Hauptfach studieren, aber dennoch Mathematikvorlesungen in ihrem Studiengang bewältigen müssen. In leicht verständlicher „Studierenden-Sprache“ und mit packenden Beispielen führt dich dieses Buch durch die faszinierende Welt der Mathematik. Hier wird komplexe Theorie auf das Wesentliche reduziert, ohne dabei an Tiefe zu verlieren. Egal, ob du dich auf Prüfungen vorbereitest oder den Vorlesungsstoff während dem Semester vertiefen möchtest, dieses Buch bietet die perfekte Mischung aus intuitiv erklärter Theorie und vorgelösten Aufgaben. Komplexe Themen wie Lineare Algebra und Integralrechnung werden mit Schemata und Tricks so vermittelt, dass partielle Integration und das Gauss-Verfahren dir plötzlich Spaß machen! Erlebe, wie Mathematik nicht nur verständlich, sondern auch faszinierend sein kann. Dieses Buch wird zu deinem verlässlichen Wegbegleiter für Verständnis und Erfolg im Studium – „Tutorium Mathematik für Naturwissenschaften“.
Twelve Landmarks of Twentieth-Century Analysis
by D. Choimet H. Queffélec Michaël Monerau Danièle Gibbons Greg GibbonsThe striking theorems showcased in this book are among the most profound results of twentieth-century analysis. The authors' original approach combines rigorous mathematical proofs with commentary on the underlying ideas to provide a rich insight into these landmarks in mathematics. Results ranging from the proof of Littlewood's conjecture to the Banach–Tarski paradox have been selected for their mathematical beauty as well as educative value and historical role. Placing each theorem in historical perspective, the authors paint a coherent picture of modern analysis and its development, whilst maintaining mathematical rigour with the provision of complete proofs, alternative proofs, worked examples, and more than 150 exercises and solution hints. This edition extends the original French edition of 2009 with a new chapter on partitions, including the Hardy–Ramanujan theorem, and a significant expansion of the existing chapter on the Corona problem.
Twenty Interviews With Psychometric Society Presidents: What’s on the Mind of the Psychometrician?
by Lisa D. WijsenTwenty Interviews with Psychometric Society Presidents tells the stories of the people who are the driving forces of psychometric research, teaching and practice. In semi-structured interviews, twenty presidents of the Psychometric Society share how they moved into the psychometric field, what inspired them to pursue this path, and what still drives them to do their research. They also reflect on the current status, history, and future of their own field, considering psychometrics' most significant historical achievements, as well as the major challenges that lie ahead. This curated collection provides a wealth of historical knowledge that is relevant for every practicing psychometrician. Introspective and insightful, it exhibits the wide array of opinions and visions in the field. Readers are invited to critically reflect on what holds this diverse field together, and what challenges and opportunities are on the horizon.
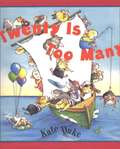
Twenty Is Too Many
by Kate DukeTwenty guinea pigs can be too many--especially if all of them are crammed on a small and tipsy boat. In this charming and boisterous book about subtraction, the guinea pigs begin to jump ship, each in his or her own funny and unique way. While children follow the story of the ever-shrinking gang of guinea pigs, they can count the furry pals leaping on and around oversized numerals representing the number of cavorting cavies on the page. A simple equation that shows the subtraction is printed along the bottom of each spread, reinforcing the concept.Like its successful predecessor, One Guinea Pig Is Not Enough, this book tells a story while teaching a number concept.
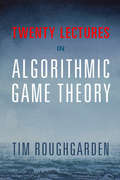
Twenty Lectures on Algorithmic Game Theory
by Tim RoughgardenComputer science and economics have engaged in a lively interaction over the past fifteen years, resulting in the new field of algorithmic game theory. Many problems that are central to modern computer science, ranging from resource allocation in large networks to online advertising, involve interactions between multiple self-interested parties. Economics and game theory offer a host of useful models and definitions to reason about such problems. The flow of ideas also travels in the other direction, and concepts from computer science are increasingly important in economics. This book grew out of the author's Stanford University course on algorithmic game theory, and aims to give students and other newcomers a quick and accessible introduction to many of the most important concepts in the field. The book also includes case studies on online advertising, wireless spectrum auctions, kidney exchange, and network management.
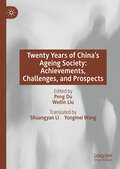
Twenty Years of China’s Ageing Society: Achievements, Challenges, and Prospects
by Peng Du Weilin LiuThis book is an in-depth study of the ageing problem in China from a multidisciplinary perspective. For the first time in Chinese history, it systematically summarizes the development process, achievements and challenges of China from the year 2000 to 2020, and illustrates the exploration process of the theory and practice to actively address population ageing with Chinese characteristics.
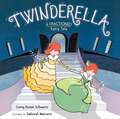
Twinderella, A Fractioned Fairy Tale
by Corey Rosen SchwartzTurns out you only know half of the story of Cinderella. Learn the rest in this mathmatically enjoyable fractioned fairy tale!Cinderella had a twin sister, Tinderella. They each did half the housework, half the mending, and half the mean step-sister tending. But when they meet only one prince, what will they do? The whole story has twice the magic and double the fun! From the author The Three Ninja Pigs comes the fractioned fairy tale of Cinderella and her less-famous sister.
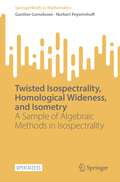
Twisted Isospectrality, Homological Wideness, and Isometry: A Sample of Algebraic Methods in Isospectrality (SpringerBriefs in Mathematics)
by Norbert Peyerimhoff Gunther CornelissenThe question of reconstructing a geometric shape from spectra of operators (such as the Laplace operator) is decades old and an active area of research in mathematics and mathematical physics. This book focusses on the case of compact Riemannian manifolds, and, in particular, the question whether one can find finitely many natural operators that determine whether two such manifolds are isometric (coverings).The methods outlined in the book fit into the tradition of the famous work of Sunada on the construction of isospectral, non-isometric manifolds, and thus do not focus on analytic techniques, but rather on algebraic methods: in particular, the analogy with constructions in number theory, methods from representation theory, and from algebraic topology.The main goal of the book is to present the construction of finitely many “twisted” Laplace operators whose spectrum determines covering equivalence of two Riemannian manifolds.The book has a leisure pace and presents details and examples that are hard to find in the literature, concerning: fiber products of manifolds and orbifolds, the distinction between the spectrum and the spectral zeta function for general operators, strong isospectrality, twisted Laplacians, the action of isometry groups on homology groups, monomial structures on group representations, geometric and group-theoretical realisation of coverings with wreath products as covering groups, and “class field theory” for manifolds. The book contains a wealth of worked examples and open problems. After perusing the book, the reader will have a comfortable working knowledge of the algebraic approach to isospectrality. This is an open access book.
